Financials
Independent Registered Municipal Advisor
2025 Annual Comprehensive Financial Report
Canaveral Port Authority
Canaveral Port Authority
2025
Wayne E. Justice * |
Jerry W. Allender |
Fritz VanVolkenburgh |


Micah Loyd |
Kevin Markey |


* Deceased Nov 8, 2025
John W. Murray |
Jeff Long |
Patricia G. Poston |
Diana Mims-Reid |


Listing of Principal Officials As of September 30, 2025
Elected Officials
The Canaveral Port Authority, governing body of the Canaveral Harbor Port District, consists of five elected Commissioners. The Board meets on the third or fourth Wednesday of each month at 9:00 A.M. The meetings are held in the Board Room of the Port Authority office building located at 445 Challenger Road. In addition, special meetings and public hearings are scheduled throughout the year.
| Commissioner | Position | Years of Service | Term Expires |
|---|---|---|---|
| Wayne Justice* | Chairman | 11 | 11/1/26 |
| Jerry Allender | Vice Chairman | 15 | 11/1/26 |
| Fritz VanVolkenburgh | Secretary/Treasurer | 3 | 11/1/26 |
| Kevin Markey | Commissioner | 4 | 11/1/28 |
| Micah Loyd | Commissioner | 9 | 11/1/28 |
*Deceased Nov 8, 2025
Appointed Officials
| Name | Title | Years of Service |
|---|---|---|
| Capt. John W. Murray | Chief Executive Officer | 9 |
| Jeff Long, PhD., CPA | Chief Financial Officer | 1 |
| Patricia G. Poston | Sr. Director, Finance | 29 |
| Diana Mims-Reid | Controller | 25 |
| Peter Bergeron | Vice President, Public Safety & Security | 4 |
| Amanda Brailsford-Urbina | Vice President, HR, Recreation & Customer Experience | 9 |
| Samantha Cornelius | Vice President, Business Development, Cargo & Aerospace | 8 |
| William Crowe, P.E. | Vice President, Engineering & Construction | 10 |
| Dave German | Vice President, Cruise Business Development | 20 |
| Craig Langley, P.E., Esq. | Vice President & General Counsel | 11 |
| Mark Lorusso | Vice President, Information Technology | 14 |
| Diane Luensmann | Vice President, Government & Strategic Communications | 8 |
| Clyde Mathis | Vice President, Cruise & Cargo Operations | 11 |
| Steven Shelton | Vice President, Facilities Optimization | 1 |
March 25, 2026
To the Canaveral Port Authority Commissioners, Chief Executive Officer (CEO) and Citizens of the Canaveral Harbor Port District:
State law requires that all general-purpose local governments, including special districts, publish within nine months of the close of each fiscal year, a complete set of financial statements presented in conformity with U. S. general accepted accounting principles (GAAP) and audited in accordance with generally accepted auditing standards and Government Auditing Standards by a firm of licensed certified public accountants. Pursuant to that requirement, we hereby issue the annual comprehensive financial report of the Canaveral Port Authority for the fiscal year ended September 30, 2025.
This report consists of management’s representations concerning the finances of the Canaveral Port Authority (the Authority). Consequently, management assumes full responsibility for the completeness and reliability of all of the information presented in this report. To provide a reasonable basis for making these representations, management of the Authority has established a comprehensive internal control framework that is designed to: 1) protect the government’s assets from loss, theft, or misuse and 2) compile sufficient reliable information for the preparation of the Authority’s basic financial statements in conformity with GAAP. Because the cost of internal controls should not outweigh their benefits, the Authority’s comprehensive framework of internal controls has been designed to provide reasonable rather than absolute assurance that the financial statements will be free from material misstatement. As management, we assert that, to the best of our knowledge and belief, this financial report is complete and reliable in all material respects.
RSM US, LLP, a firm of licensed certified public accountants, has audited the Canaveral Port Authority’s basic financial statements. The goal of the independent audit was to provide reasonable assurance that the financial statements of the Authority for the fiscal year ended September 30, 2025, are free of material misstatement. The independent audit involved examining, on a test basis, evidence supporting the amounts and disclosures in the financial statements; assessing the accounting principles used and significant estimates made by management; and evaluating the overall financial statement presentation. The independent auditor concluded, based upon the audit, that there was a reasonable basis for rendering an unmodified opinion that the Authority’s basic financial statements for the fiscal year ended September 30, 2025 are fairly presented. These statements are included as the first component of the financial section of this report.
GAAP requires that management provide a narrative introduction, overview, and analysis to accompany the basic financial statements in the form of Management’s Discussion and Analysis (MD&A). This letter of transmittal is designed to complement the MD&A and should be read in conjunction with it. The Canaveral Port Authority’s MD&A can be found immediately following the report of the independent auditor.
Profile of the Authority
The Canaveral Harbor Port District, as presently structured, was created by House Bill Number 1136, Chapter 28922, from the Laws of Florida Special Acts of 1953, as amended and restated by Chapter 2003-335, Laws of Florida, Acts of 2003, and acts amendatory thereof and supplemental thereto. This bill created, organized and established a port district in Brevard County, Florida and designated the area as the Canaveral Harbor Port District. The Authority is a quasi-public governmental body, an independent special taxing district that is a political subdivision of the State of Florida. As such, it is not under the jurisdiction of Brevard County or any neighboring city.
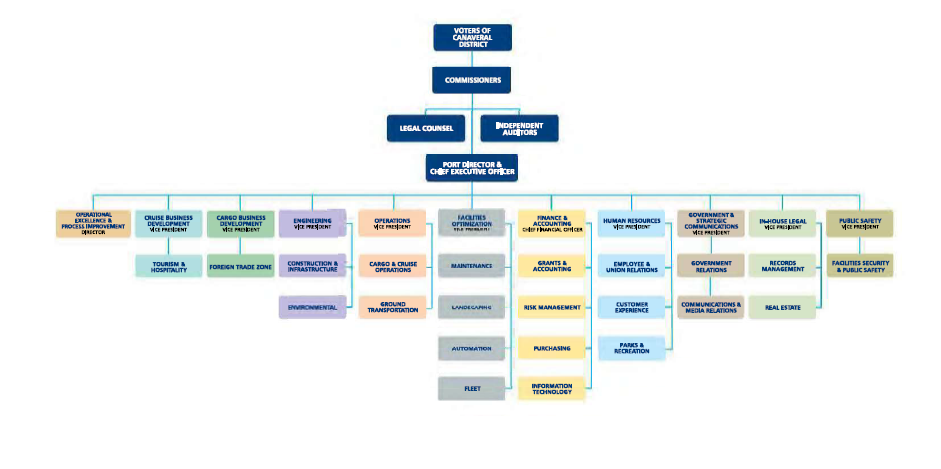
The Authority has operated under the Commission-manager form of government since 1953. Five elected commissioners, representing the five Port districts, serve as a board of directors and have jurisdiction over all fiscal and regulatory policies and operations of the Port. Commissioners are chosen by the public via an at-large election and serve four-year terms. These terms are staggered, with three commissioners up for election at one time, and the remaining two up for election two years hence. As an independent special district of the State of Florida, the Authority is empowered to levy ad valorem taxes to finance expansion and operation, incur indebtedness through the sale of bonds or use of bank loans, establish tariff rates, negotiate for government grants, condemn necessary land, zone its land, and exercise police powers. The commission is responsible, among other things, for passing policies, adopting a budget, appointing committees, and hiring both the government’s manager (CEO) and attorney. The CEO’s authority and responsibilities are similar to those of both the manager of a local government and the president of a sizable private corporation. The major goals of the Authority are to give the residents of the area the benefits of low-cost ocean transportation, a foreign trade zone and to create economic opportunity and jobs. The Authority also provides substantial facilities for recreation for the local population and visitors alike.
The annual Operating and Capital Budgets serve as the foundation for the Authority’s financial planning and control. All departments of the Authority are required to submit budget requests to the CEO during June of each year. The CEO uses these requests as the starting point for developing a proposed budget. The Chief Financial Officer (CFO) then prepares and presents this proposed budget to the commission for review prior to September 30. The commission holds two public hearings on the proposed budget and adopts a final budget no later than September 30, the close of the Authority’s fiscal year (FY). The Operating Budget is prepared by functional department. Due to operating or unforeseen activities during the year, department heads may request modifications to their departmental budget. Any proposed changes to the overall total of the Operating Budget are approved by the commission at a public hearing. Changes to the Capital Budget are more fluid, but do require review by the commission.
Economic Conditions in Fiscal Year 2025
The information presented in the financial statements is perhaps best understood when it is considered from the broader perspective of the specific environment within which the Authority operates.
Local Economy
The Canaveral Harbor Port District encompasses approximately the northern two-thirds of Brevard County. The County is home to a number of large employers, both public and private. According to the U.S Department of Labor, Bureau of Labor Statistics, the Nation’s unemployment rate at September 2025 is estimated at 4.4%, the State of Florida unemployment rate is 3.9% and Brevard County Florida is 4.6%.
Economic Outlook
The Authority is strategically located on the central east coast of the state and enjoys a significant “drive-to” market for cruising. During Fiscal Year 2025, the Authority’s total operating revenue was $218 million.
For Fiscal Year 2025, cruise revenue was $182 million and total multi-day revenue passengers were 8,602,047.
Cargo related revenue for Fiscal Year 2025 was $24.5 million which was based on ship related revenue of $18.3 million and cargo lease revenue of $6.2 million. The total tonnage of 6,123,295 included the commodities - petroleum, limestone, granite, forest products and slag. These materials contribute to a diversified cargo base and supports construction and growth in Central Florida.
The Authority continues to implement security measures to ensure the safety of the traveling public as well as Port Canaveral tenants. The annual costs of these services was $14.4 million for FY2025.
Long-Term Financial Planning
In addition to the Authority’s operating budget process, a $912 million five-year capital plan has been developed to assess future needs. As part of this capital plan, projects are continuously evaluated to determine whether any new projects will yield an appropriate rate of return before any investment is considered when additional funding is needed. The Authority continues to invest its cash resources to achieve the desired results along with prudent borrowing policies using bond financing and bank debt. A key component of capital project analysis also includes the availability of Federal and State agencies grant funding.
Relevant Financial Policies
The Authority continues to follow financial policies in effect which includes policies governing budget, investment, internal controls, leasing land, travel, purchasing, and Commissioners’ minor expenses. These policies are reviewed annually, with amendments approved by the board.
Major Initiatives
The Authority continues to expand and improve its cruise, cargo, recreational and real estate facilities, and infrastructure. For FY2025, the capital budget consisted of several major projects, including the multiyear rehabilitation of North Cargo Berth 4, Portwide Parking Improvements and Garages, Roads and Utility Improvements, Maintenance Dredging, Cruise Terminal 5 & 10 Upgrades, Cruise Terminal 6 Improvements, Mobile Harbor Cranes and Passenger Boarding Bridge Improvements. The total investment of these projects totaled $65.7 million.
Some of the major projects that were completed during FY2025 include the completion of new Parking facilities and Portwide parking lot improvements at a cost of $68 million, Road Improvements at a cost of $2 million, Improvements to Piers, Buildings, and Structures at a cost of $5 million, Cruise Terminal Furniture/Equipment upgrades at a cost of $2.1 million, and Cruise Terminal 10 Improvements at a cost of $4.2 million.
The Authority’s improvements are funded from existing cash flow as a result of the revenues from existing and projected cruise, cargo, and land lease operations, and Federal and State grants. The Port continues to seek federal and state assistance in the form of grants and capital improvement funding.
Awards and Acknowledgments
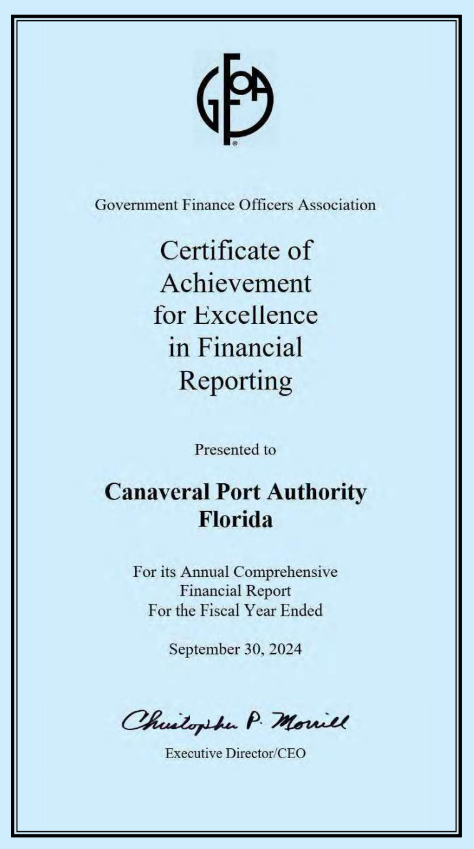
The Government Finance Officers Association of the United States and Canada (GFOA) awarded a Certificate of Achievement for Excellence in Financial Reporting to the Canaveral Port Authority for its annual comprehensive financial report for the fiscal year ended September 30, 2024. This was the thirty-fourth consecutive year that the Authority has received this prestigious award. In order to be awarded a Certificate of Achievement, the Authority published an easily readable and efficiently organized annual comprehensive financial report. This report must satisfy both generally accepted accounting principles and applicable legal requirements.
A Certificate of Achievement is valid for a period of one year only. We believe that our current annual comprehensive financial report continues to meet the Certificate of Achievement Program’s requirements and we are submitting it to the GFOA to determine its eligibility for another certificate.
The preparation of this report would not have been possible without the efficient and dedicated services of the entire staff of the Finance Department. I would like to extend my thanks to all members of the department who assisted and contributed to the preparation of this report, with special recognition given to Controller, Diana Mims-Reid. Thanks and appreciation are also extended to Raymond Jessee with his help on reviewing and coordinating this report and also to the firm of RSM US, LLP for their professional approach and high standards in the conduct of their independent audit of the Authority’s financial records and transactions.
Finally, I would also like to express my appreciation to the Canaveral Port Authority Board of Commissioners and CEO John Murray for their guidance and support throughout the year. I appreciate their interest and leadership in planning and conducting the financial operation of the Authority in a progressive and responsible manner.

![]()
RSM US LLP
Independent Auditor’s Report
Board of Commissioners
Canaveral Port Authority
Report on the Audit of the Financial Statements
Opinion
We have audited the financial statements of the Canaveral Port Authority (the Authority) as of and for the year ended September 30, 2025, and the related notes to the financial statements, which collectively comprise the Authority’s basic financial statements as listed in the table of contents.
In our opinion, the accompanying financial statements referred to above present fairly, in all material respects, the financial position of the Authority, as of September 30, 2025, and the changes in its financial position and its cash flows for the year then ended in accordance with accounting principles generally accepted in the United States of America.
Basis for Opinion
We conducted our audit in accordance with auditing standards generally accepted in the United States of America (GAAS). Our responsibilities under those standards are further described in the Auditor’s Responsibilities for the Audit of the Financial Statements section of our report. We are required to be independent of the Authority, and to meet our other ethical responsibilities, in accordance with the relevant ethical requirements relating to our audit. We believe that the audit evidence we have obtained is sufficient and appropriate to provide a basis for our audit opinion.
Emphasis of Matter
As discussed in Note 6 to the basic financial statements, the Authority adopted the recognition and disclosure requirements of Governmental Accounting Standards Board Statement No. 101, Compensated Absences, as of October 1, 2024. As a result of the adoption, the Authority restated beginning net position. Our opinion is not modified with respect to this matter.
Responsibilities of Management for the Financial Statements
Management is responsible for the preparation and fair presentation of the financial statements in accordance with accounting principles generally accepted in the United States of America, and for the design, implementation and maintenance of internal control relevant to the preparation and fair presentation of financial statements that are free from material misstatement, whether due to fraud or error.
In preparing the financial statements, management is required to evaluate whether there are conditions or events, considered in the aggregate, that raise substantial doubt about the Authority’s ability to continue as a going concern for 12 months beyond the financial statement date, including any currently known information that may raise substantial doubt shortly thereafter.
Auditor’s Responsibilities for the Audit of the Financial Statements
Our objectives are to obtain reasonable assurance about whether the financial statements as a whole are free from material misstatement, whether due to fraud or error, and to issue an auditor’s report that includes our opinion. Reasonable assurance is a high level of assurance but is not absolute assurance and therefore is not a guarantee that an audit conducted in accordance with GAAS will always detect a material misstatement when it exists. The risk of not detecting a material misstatement resulting from fraud is higher than for one resulting from error, as fraud may involve collusion, forgery, intentional omissions, misrepresentations or the override of internal control. Misstatements are considered material if there is a substantial likelihood that, individually or in the aggregate, they would influence the judgment made by a reasonable user based on the financial statements.
In performing an audit in accordance with GAAS, we:
Exercise professional judgment and maintain professional skepticism throughout the audit.
Identify and assess the risks of material misstatement of the financial statements, whether due to fraud or error, and design and perform audit procedures responsive to those risks. Such procedures include examining, on a test basis, evidence regarding the amounts and disclosures in the financial statements.
Obtain an understanding of internal control relevant to the audit in order to design audit procedures that are appropriate in the circumstances, but not for the purpose of expressing an opinion on the effectiveness of the Authority’s internal control. Accordingly, no such opinion is expressed.
Evaluate the appropriateness of accounting policies used and the reasonableness of significant accounting estimates made by management, as well as evaluate the overall presentation of the financial statements.
Conclude whether, in our judgment, there are conditions or events, considered in the aggregate, that raise substantial doubt about the Authority’s ability to continue as a going concern for a reasonable period of time.
We are required to communicate with those charged with governance regarding, among other matters, the planned scope and timing of the audit, significant audit findings and certain internal control-related matters that we identified during the audit.
Required Supplementary Information
Accounting principles generally accepted in the United States of America require that the management’s discussion and analysis and the schedule of changes in total OPEB liability be presented to supplement the basic financial statements. Such information is the responsibility of management and, although not a part of the basic financial statements, is required by the Governmental Accounting Standards Board who considers it to be an essential part of financial reporting for placing the basic financial statements in an appropriate operational, economic or historical context. We have applied certain limited procedures to the required supplementary information in accordance with GAAS, which consisted of inquiries of management about the methods of preparing the information and comparing the information for consistency with management’s responses to our inquiries, the basic financial statements and other knowledge we obtained during our audit of the basic financial statements. We do not express an opinion or provide any assurance on the information because the limited procedures do not provide us with sufficient evidence to express an opinion or provide any assurance.
Other Information
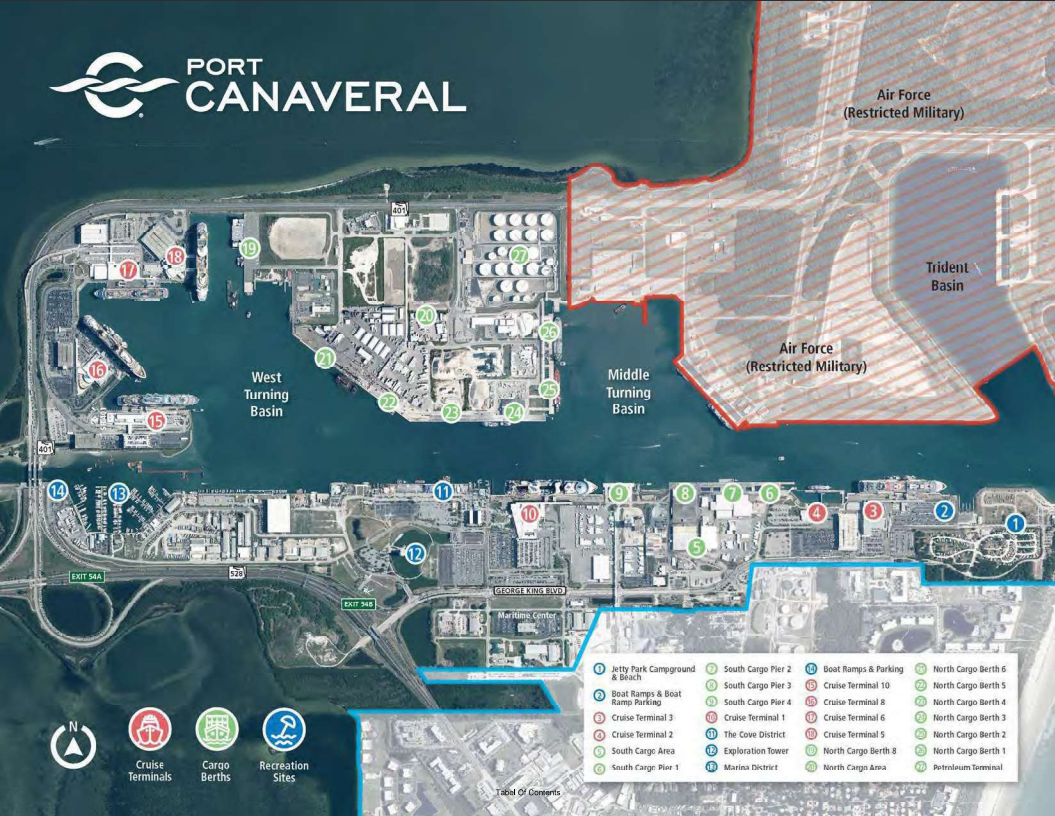
Management is responsible for the other information included in the annual comprehensive financial report. The other information comprises the introductory and statistical sections, the schedule of comparative revenues, expenses and changes in net position, the schedule of comparative operating revenues by activity, the schedule of construction in progress and capital costs compared with budget (prior to transfer of completed projects to capital assets), the schedule of insurance in force, and the map of Port Canaveral, as listed in the table of contents, but does not include the basic financial statements and our auditor’s report thereon. Our opinion on the basic financial statements does not cover the other information, and we do not express an opinion or any form of assurance thereon.
In connection with our audit of the basic financial statements, our responsibility is to read the other information and consider whether a material inconsistency exists between the other information and the basic financial statements, or the other information otherwise appears to be materially misstated. If, based on the work performed, we conclude that an uncorrected material misstatement of the other information exists, we are required to describe it in our report.

Tampa, Florida
March 18, 2026
As management of the Canaveral Port Authority (the Authority), we offer readers of the Authority’s financial statements this narrative overview and analysis of the financial activities of the Authority for the fiscal year ended September 30, 2025. All amounts, unless otherwise indicated, are expressed in thousands of dollars.
Financial Highlights
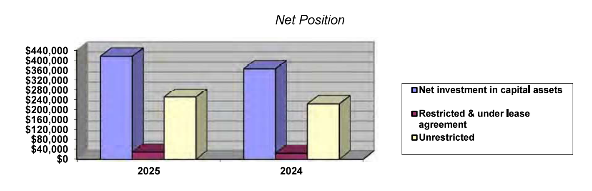
- The assets and deferred outflows of the Authority exceeded its liabilities and deferred inflows at the close of the most recent fiscal year by $694,325 (net position). Of this amount, $250,071 is the unrestricted net position and is available to meet the Authority’s ongoing obligations to creditors.
- The Authority's total net position increased by $83,732. This consists of an increase in net investment in capital assets of $50,482, an increase in restricted net position of $189, restricted under lease agreements $5,000, and an increase in unrestricted net position of $28,061.
- At the end of the current fiscal year, the unrestricted net position was 167.89% of total expenses.
Overview of the Financial Statements
This discussion and analysis are intended to serve as an introduction to the Authority’s basic financial statements. The Authority’s basic financial statements are comprised of two components: enterprise financial statements and notes to the financial statements. This report also contains the required supplementary information, other supplementary information, and other information in addition to the basic financial statements themselves.
The basic financial statements report information about the Authority using the full accrual basis of accounting as utilized by similar business activities in the private sector. The basic financial statements include a statement of net position, a statement of revenues, expenses and changes in net position and a statement of cash flows.
The statement of net position presents information on all the Authority’s assets and deferred outflows of resources, as well as liabilities and deferred inflows of resources, with the difference between the two groups reported as total net position. Over time, increases or decreases in net position may serve as a useful indicator of whether the financial position of the Authority is improving or deteriorating.
The statement of revenues, expenses and changes in net position presents information showing how the Authority’s net position changed during the fiscal year. All changes in net position are reported as soon as the underlying event giving rise to the change occurs, regardless of the timing of related cash flows. Thus, revenues and expenses are reported in this statement for some items that will only result in cash flows in future fiscal periods.
The statement of cash flows presents changes in cash and cash equivalents from operational, financing and investing activities. This statement presents cash receipt and disbursement information without consideration of the earnings event, when an obligation arises, or depreciation of capital assets.
The notes on the financial statements provide additional information that is essential to a full understanding of the data provided in the basic financial statements.
In addition to the basic financial statements and accompanying notes, this report also presents other required supplementary information, other supplementary information, and other information.
Financial Analysis
As noted earlier, net position may serve over time as a useful indicator of the Authority’s financial position.
The following table reflects the condensed statements of net position as of September 30:
| Change | |||||||
|---|---|---|---|---|---|---|---|
| 2025 | 2024 * | Amount | % | ||||
| Current and other assets | $ | 342,676 | $ | 308,461 | $ | 34,215 | 11.1% |
| Capital assets | 774,333 | 743,763 | 30,570 | 4.1% | |||
| Total assets | 1,117,009 | 1,052,224 | 64,785 | 6.2% | |||
| Deferred outflows of resources | 797 | 356 | 441 | 123.9% | |||
| Current liabilities | 54,755 | 52,571 | 2,184 | 4.2% | |||
| Noncurrent liabilities | 331,635 | 349,268 | (17,633) | -5.0% | |||
| Total liabilities | 386,390 | 401,839 | (15,449) | -3.8% | |||
| Deferred inflows of resources | 37,091 | 40,147 | (3,056) | -7.6% | |||
| Net position: | |||||||
| Net investment in capital assets | 415,961 | 365,479 | 50,482 | 13.8% | |||
| Restricted for debt service | 13,293 | 13,104 | 189 | 1.4% | |||
| Restricted under lease agreements | 15,000 | 10,000 | 5,000 | 50.0% | |||
| Unrestricted | 250,071 | 222,010 | 28,061 | 12.6% | |||
| Total net position | $ | 694,325 | $ | 610,593 | $ | 83,732 | 13.7% |
*FY24 financial statements have been restated due to implementation of GASB 101, Compensated Absences.
Current assets increased because of a strong year of cruise operations with 8.6 million passengers. By far the largest portion (59.9%) of the Authority’s net position as of September 30, 2025, reflects its investment in capital assets (e.g., land, buildings, improvements, equipment, intangibles and construction in progress); less any related debt used to acquire those assets that are still outstanding. These assets are not available for future spending. Although the Authority’s investment in its capital assets is reported net of related debt, it should be noted that the resources needed to repay this debt must be provided from operations, since the capital assets themselves cannot be used to liquidate these liabilities. At the end of the current fiscal year, the Authority’s net investment in capital assets increased by $50,482.
In addition, a portion (1.9%) of the Authority’s net position as of September 30, 2025, represents the reserve for maximum debt service restricted in accordance with existing bond covenants and (2.2%) is restricted under lease agreements. The remaining balance of unrestricted net position may be used to meet the Authority’s ongoing obligations to creditors. At the end of the current fiscal year, the Authority’s unrestricted net position increased by $28,061.
The Authority’s total net position increased by $83,732 during the current fiscal year. Of this amount, an increase of $81,442 represents net income before capital contributions. The remaining increase of $2,290 represents the capital contributions (grant proceeds) from federal and state sources. There is no assurance that these capital contributions from other sources will continue in the future.
The following table shows condensed revenue and expense data for the years ended September 30:
| Change | |||||||
| 2025 | 2024* | Amount | % | ||||
| Operating revenues: | |||||||
| Cruise | $ | 181,885 | $ | 156,032 | $ | 25,853 | 16.6% |
| Cargo | 24,542 | 23,216 | 1,326 | 5.7% | |||
| Leases | 4,480 | 5,749 | (1,269) | -22.1% | |||
| Other | 7,023 | 6,855 | 168 | 2.5% | |||
| Total operating revenues | 217,930 | 191,852 | 26,078 | 13.6% | |||
| Non-operating revenues: | |||||||
| Investment earnings | 11,402 | 11,332 | 70 | 0.6% | |||
| Other | 1,057 | 1,082 | (25) | -2.3% | |||
| Total non-operating revenues | 12,459 | 12,414 | 45 | 0.4% | |||
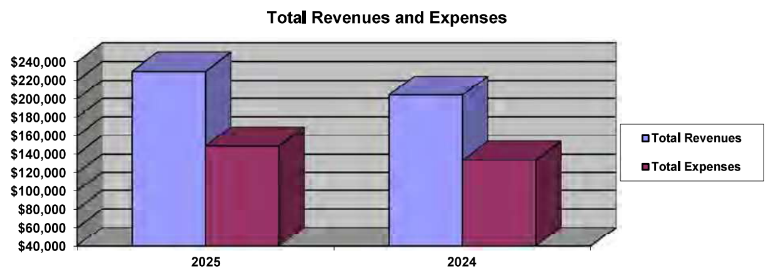
| Total revenues | 230,389 | 204,266 | 26,123 | 12.8% | |||
| Operating expenses: | |||||||
| Operations, facilities and public safety | 58,367 | 47,021 | 11,346 | 24.1% | |||
| Executive, finance and administration | 17,818 | 16,765 | 1,053 | 6.3% | |||
| Engineering and environmental | 2,972 | 2,472 | 500 | 20.2% | |||
| Other | 6,754 | 5,868 | 886 | 15.1% | |||
| Depreciation and amortization | 49,593 | 47,837 | 1,756 | 3.7% | |||
| Total operating expenses | 135,504 | 119,963 | 15,541 | 13.0% | |||
| Non-operating expenses: | |||||||
| Interest | 11,426 | 12,414 | (988) | -8.0% | |||
| Loss on disposal of capital assets | 1,491 | 1,210 | 281 | 0.0% | |||
| Other | 526 | 296 | 230 | 77.7% | |||
| Total non-operating expenses | 13,443 | 13,920 | (477) | -3.4% | |||
| Total expenses | 148,947 | 133,833 | 15,064 | 11.3% | |||
| Income before contributions | 81,442 | 70,383 | 11,059 | 15.7% | |||
| Capital contributions | 2,290 | 14,646 | (12,356) | -84.4% | |||
| Change in net position | 83,732 | 85,029 | (1,297) | -1.5% | |||
| Net position - beginning | 610,281 | 525,252 | 85,029 | 16.2% | |||
| Net position - ending | $ | 694,013 | $ | 610,281 | $ | 83,732 | 13.7% |
*FY24 financial statements have been restated due to implementation of GASB 101, Compensated Absences.
Key elements of the increase in net position for the fiscal year ended September 30, 2025, are as follows.
- Total operating fees and charges for services had an increase of 13.6% overall change. Included in the total operating revenues were cruise operations (including parking), cargo, and recreation (Jetty Park), which increased 16.6%, 5.7% and 2.5%, respectively. There was a decrease from leases of 22.1%.
- Overall, non-operating revenues increased, which included investment earnings, grant revenue and gains on sale of assets or legal settlements. Investment earnings increased by $70 thousand due to stable interest rates throughout the year.
- Capital contributions from federal and state grants for capitalized projects decreased during the current fiscal year by $12.4 million. This decrease was due to the completion of North Cargo Berth 3 and the completion of related deferred reimbursement grants.
Capital assets: The Canaveral Port Authority’s capital assets as of September 30, 2025 and 2024, amount to $774,333 and $743,763, respectively, (net of accumulated depreciation). These balances include land, buildings, improvements, equipment, intangibles and construction in progress. The total increase in the Authority’s capital assets was 4.1% for fiscal year 2025.
Major capital asset events during the current fiscal year included the following:
- Construction continued on several major projects for the Authority including northside parking garages, Improvement to Piers and Buildings, Cruise Terminal 5 & 10 Upgrades, North Cargo Berth 4 Improvements and Passenger Boarding Bridge Improvements. Total investments in capital projects totaled $80,133 and were offset by the total value of projects completed and moved from Construction in Progress to capital assets of $95,516.
Several major projects included in Construction in Progress on September 30, 2024, were completed during fiscal year 2025, including:
- Portwide Parking Improvements at $62,229
- CT10 Terminal Improvements at $4,234
- Park Upgrades at $3,069
- Improvements to Piers, Buildings, Structures at $5,007
- Portwide Parking Lot Improvements at $5,770
Commitments for the repair, modification, improvements, materials and new construction of Authority owned property on September 30, 2025, totaled $205,711.
Additions for the year ended September 30, 2025, were offset by depreciation expense of $48,372 and amortization expense of $1,221.
The following table shows capital assets by category for the years ended September 30:
| Change | |||||||
| 2025 | 2024 | Amount | % | ||||
| Land | $ | 5,471 | $ | 5,471 | $ | - | 0.0% |
| Buildings | 221,439 | 168,051 | 53,388 | 31.8% | |||
| Improvements other than | |||||||
| buildings | 395,054 | 404,015 | (8,961) | -2.2% | |||
| Equipment | 40,886 | 38,139 | 2,747 | 7.2% | |||
| Intangibles | 3,542 | 4,763 | (1,221) | -25.6% | |||
| Construction in progress | 107,941 | 123,324 | (15,383) | -12.5% | |||
| Total | $ | 774,333 | $ | 743,763 | $ | 30,570 | 4.1% |
Additional information on the Canaveral Port Authority’s capital assets can be found in Note 3.D. in this report.
Long-term debt: On September 30, 2025, the Canaveral Port Authority had total bonded debt outstanding of $318,390 and lines of credit with outstanding balances of $5 million and $16 million. The Canaveral Port Authority’s debt represents bonds secured solely by operating revenues (i.e., revenue bonds).
The Canaveral Port Authority’s total revenue and direct borrowing bonds decreased by $17,296 (5.15%). The major factor for the decrease during the current year was due to regular scheduled principal payments and no new issuances this year.
Additional information on the Canaveral Port Authority’s long-term debt can be found in Note 3.G. and 3.H. in this report.
Economic Factors and Next Year’s Budgets and Rates
For FY2026, the Authority has budgeted the following:
- Charges for services of $237 million due to projected cruise and cargo related business.
- Operating expenses of $159 million (including $57 million for depreciation) which contain funding for cruise activities.
- Non-operating revenues of $9 million, which is mostly investment earnings.
Requests for Information
This financial report is designed to provide a general overview of the Canaveral Port Authority’s finances for all those with an interest in the Authority’s finances. Questions concerning any of the information provided in this report or requests for additional financial information should be addressed to the Finance Department, Canaveral Port Authority, 445 Challenger Road, Suite 301, Cape Canaveral, Florida 32920.
September 30, 2025
| Assets | |
| Current assets: | |
| Cash and cash equivalents | $ 215,273,076 |
| Investments | 1,297,007 |
| Accounts receivable - trade, net | 9,197,468 |
| Interest receivable | 433,425 |
| Lease receivable | 3,799,641 |
| Prepaid expenses | 3,234,036 |
| Due from other governmental units | 2,411,647 |
| Inventory | 1,147,041 |
| Deposits and other receivables, current | 18,630 |
| Total current assets | 236,811,971 |
| Noncurrent assets: | |
| Cash and cash equivalents - restricted | 13,292,780 |
| Investments | 41,912,328 |
| Lease receivable | 35,199,673 |
| Deposits with escrow agent and other receivables, long-term | 15,459,117 |
| Capital assets (net of accumulated depreciation and amortization): | |
| Land (non-depreciable) | 5,470,630 |
| Buildings | 221,439,326 |
| Improvements other than buildings | 395,053,891 |
| Equipment | 40,886,460 |
| Intangible assets | 3,542,018 |
| Construction in progress (non-depreciable) | 107,940,395 |
| Total noncurrent assets | 880,196,618 |
| Total assets | 1,117,008,589 |
| Deferred outflows of resources: | |
| Other post-employment benefits (OPEB) related amounts | 796,709 |
| Total deferred outflows of resources | 796,709 |
(Continued)
| Liabilities | Amount |
|---|---|
| Current liabilities: | |
| Accounts payable and accrued expenses | $29,803,306 |
| Accrued compensated balances | 642,338 |
| Unearned revenue | 797,523 |
| Payroll and sales taxes payable | 310,399 |
| Revenue bonds and direct borrowing bonds, current portion | 17,419,000 |
| Accrued interest payable | 1,419,525 |
| OPEB liability, current portion | 56,467 |
| Other liabilities, current portion | 1,950,567 |
| Payable from restricted assets: | |
| Accrued interest payable | 2,080,488 |
| Revenue bonds payable, current portion | 275,000 |
| Total current liabilities | 54,754,613 |
| Noncurrent liabilities: | |
| Revenue bonds and direct borrowing bonds, less current portion | 305,210,014 |
| Compensated absences, less current portion | 2,285,678 |
| Lines of credit | 21,000,000 |
| OPEB liability, less current portion | 2,022,286 |
| Other liabilities, long-term portion | 1,117,092 |
| Total noncurrent liabilities | 331,635,070 |
| Total liabilities | 386,389,683 |
| Deferred inflows of resources: | |
| Leases | 35,856,965 |
| OPEB related amounts | 1,234,110 |
| Total deferred inflows of resources | 37,091,075 |
| Net position: | |
| Net investment in capital assets | 415,961,203 |
| Restricted for debt service | 13,292,780 |
| Restricted under lease agreements | 15,000,000 |
| Unrestricted | 250,070,557 |
| Total net position | $694,324,540 |
See notes to financial statements.
| Description | Amount |
|---|---|
| Operating revenues: | |
| Cruise | $181,884,695 |
| Cargo | 24,541,740 |
| Leases | 4,480,248 |
| Other | 7,023,137 |
| Total operating revenues | 217,929,820 |
| Operating expenses: | |
| Operations | 17,740,657 |
| Facilities | 26,201,250 |
| Parks and recreation | 2,498,022 |
| Public safety | 14,425,929 |
| Fire training facility | 438,403 |
| Commission | 355,177 |
| Executive | 3,392,510 |
| Finance and accounting | 2,495,957 |
| Administrative services | 11,929,310 |
| Engineering and environmental | 2,972,347 |
| Business development | 1,119,479 |
| Real estate | 525,974 |
| Government and strategic communications | 1,816,834 |
| Depreciation | 48,372,263 |
| Amortization | 1,220,748 |
| Total operating expenses | 135,504,860 |
| Operating income | 82,424,960 |
| Non-operating revenues: | |
| Investment earnings | 11,402,252 |
| Grant revenue | 903,589 |
| Gain on sale of capital assets | 152,804 |
| Total non-operating revenues | 12,458,645 |
| Non-operating expenses: | |
| Interest expense | 11,426,261 |
| Loss on disposal of capital assets | 1,490,639 |
| Other non-operating expenses | 525,806 |
| Total non-operating expenses | 13,442,706 |
| Income before capital contributions: | 81,440,899 |
| Capital contributions | 2,290,263 |
| Change in net position | 83,731,162 |
| Net position, beginning of year, as restated see Note 6. | 610,593,378 |
| Net position, end of year | 694,324,540 |
See notes to financial statements.
| Description | Amount |
|---|---|
| Cash flows from operating activities: | |
| Cash received from customers and users | $ 212,108,932 |
| Cash paid to suppliers for goods and services | (57,994,184) |
| Cash payments to employees for services | (24,850,999) |
| Net cash provided by operating activities | 129,263,749 |
| Cash flows from non-capital financing activities: | |
| Cash received from grants | 927,108 |
| Net cash provided by non-capital financing activities | 927,108 |
| Cash flows from capital and related financing activities: | |
| Interest paid on revenue bonds and direct borrowing bonds | (11,800,191) |
| Lease interest payments on leases | 1,218,251 |
| Principal paid on revenue bonds and direct borrowing bonds | (17,296,000) |
| Acquisition and construction of capital assets | (82,491,631) |
| Payments made on lines of credit | (4,280) |
| Proceeds from sale of capital assets | 57,512 |
| Capital contributions | 12,448,637 |
| Net cash used in capital and related financing activities | (97,867,702) |
| Cash flows from investing activities: | |
| Interest received on investments | 11,130,274 |
| Purchase of investments | (16,201,284) |
| Proceeds from sale of investments | 271,977 |
| Net cash used in investing activities | (4,799,033) |
| Net change in cash and cash equivalents | 27,524,122 |
| Cash and cash equivalents: | |
| Beginning of year | 201,041,734 |
| End of year | $ 228,565,856 |
| Reconciliation to the statement of net position: | |
| Cash and cash equivalents | 215,273,076 |
| Cash and cash equivalents – restricted | 13,292,780 |
| $ 228,565,856 |
(Continued)
| Reconciliation of operating income to net cash provided by operating activities: | |
| Operating income | $ 82,424,960 |
| Adjustment to reconcile operating income to net cash provided by operating activities: | |
| Depreciation expense | 48,372,263 |
| Amortization expense | 1,220,748 |
| (Increase) decrease in assets and deferred outflows: | |
| Accounts receivable | 955,596 |
| Inventory | (375,476) |
| Lease receivables | 921,189 |
| Deposits and other receivables | (4,797,213) |
| Prepaid expenses | 1,368,442 |
| Deferred outflows of resources – OPEB | (440,685) |
| Increase (decrease) in liabilities and deferred inflows: | |
| Accounts payable and accrued expenses | 2,471,805 |
| Unearned revenue | 10,811 |
| Compensated absences | 359,964 |
| OPEB liability - current | 56,467 |
| OPEB liability - LT | 700,915 |
| Deferred inflows of resources - leases | (2,905,669) |
| Deferred inflows of resources - OPEB | (150,412) |
| Other liabilities | (932,805) |
| Payroll and sales tax payable | 2,849 |
| Total adjustments | 46,838,789 |
| Net cash provided by operating activities | $ 129,263,749 |
Supplemental schedule of noncash investing, capital and financing activities:
- During 2025, the Authority recorded an unrealized gain on investments of $271,977.
- During 2025, the Authority’s balance in due from other governmental units relating to capital contributions is $2,411,647.
- On September 30, 2025, the Authority had capital asset additions included in accounts payable of $14,742,502.
See notes to financial statements.
| Notes to Financial Statements | ||
| Note | Contents | PAGE |
| 1. | Summary of Significant Accounting Policies | |
| A. Reporting Entity | 9 | |
| B. Measurement, Focus, Basis of Accounting and Financial Statement Presentation | 9 | |
| C. Assets, Deferred Outflows, Liabilities, Deferred Inflows and Net Position | 9 | |
| D. Revenues and Expenses | 13 | |
| E. Estimates | 14 | |
| 2. | Budgetary Information | 14 |
| 3. | Detail Notes | |
| A. Cash and Cash Equivalents and Investments | 14 | |
| B. Restricted Cash and Cash Equivalents | 17 | |
| C. Leases | 17 | |
| D. Capital Assets | 20 | |
| E. Accounts Payable and Accrued Expenses | 20 | |
| F. Other Liabilities | 20 | |
| G. Revenue Bonds and Direct Borrowing Bonds | 21 | |
| H. Lines of Credit | 26 | |
| I. Changes in Long-Term Liabilities | 27 | |
| J. Restricted Net Position | 27 | |
| K. Defined Contribution Plan | 27 | |
| L. Other Post-Employment Benefits | 28 | |
| M. Major Customers | 31 | |
| N. Risk Management | 31 | |
| O. Concentration - Collective Bargaining Unit | 31 | |
| P. Capital Contributions | 32 | |
| 4. | Commitments and Contingencies | |
| A. Construction | 32 | |
| B. Litigation | 32 | |
| C. Grants Programs | 32 | |
| 5. | Accounting Pronouncements | 32 |
| 6. | Restatement - Implementation of GASB Statement No. 101, Compensated Absences | 33 |
Note 1. Summary of Significant Accounting Policies
A. Reporting Entity
The Canaveral Port Authority (the Authority) is an independent special taxing Authority and a political subdivision of the state of Florida (the State) which was established in 1953 by Chapter 28922, Laws of Florida, and Special Acts of 1953, as amended in 2014 (the Enabling Act). The governing body of the Authority is the Board of Commissioners (Board) composed of one commissioner elected from each of the five districts created by the Enabling Act.
B. Measurement Focus, Basis of Accounting and Financial Statement Presentation
The Authority is a special purpose government entity engaged in business type activities and uses a single enterprise fund for the presentation of its financial statements. Enterprise fund financial statements are reported using the economic resources measurement focus and the accrual basis of accounting. Revenues are recorded when earned and expenses are recorded when a liability is incurred, regardless of the timing of the related cash flows.
The Authority operates as an enterprise fund that accounts for the construction, operation and maintenance of the Authority. An enterprise fund is a type of proprietary fund that provides services to the general public. This fund is used to account for the acquisition, operation and maintenance of governmental facilities and services which are entirely or predominantly self-supported by user charges. The operations of the Authority are accounted for in such a manner as to show a profit or loss, similar to comparable private enterprises.
Proprietary funds distinguish operating revenues and expenses from non-operating items. Operating revenues and expenses result from providing services and producing and delivering goods in connection with a proprietary fund’s principal ongoing operations. The principal operating revenues of the Authority are fees and charges for cruise ships, cargo ships and land leases. Operating expenses include costs to operate and maintain facilities of the Authority, administrative expenses and depreciation and amortization expenses related to long-lived assets. All revenues and expenses not meeting these definitions are reported as non-operating revenues and expenses.
When both restricted and unrestricted resources are available for use, it is the Authority’s policy to use restricted resources first, then unrestricted resources as they are needed.
C. Assets, Deferred Outflows, Liabilities, Deferred Inflows and Net Position
1. Cash and Cash Equivalents
Florida state statutes authorize the government to invest in the Local Government Surplus Funds Trust Fund (Florida PRIME), an external investment pool, or any intergovernmental investment pool authorized pursuant to Florida Interlocal Cooperation Act, Securities and Exchange Commission (SEC) registered money market funds with the highest credit quality rating, interest-bearing time deposits or savings accounts in qualified public depositories and direct obligations of the U.S. Treasury.
Florida PRIME is administered by the Florida State Board of Administration, who provides regulatory oversight. The Authority’s investment in Florida PRIME is reported at amortized cost. The fair value of the Authority’s position in Florida PRIME is equal to the value of pooled shares. Florida PRIME is managed by the Florida State Board of Administration and has annual audited financial statements that can be obtained on their website: https://prime.sbafla.com/.
The Authority also invests in Florida Public Assets for Liquidity Management (PALM). PALM is a common law trust organized under the laws of the State of Florida and offers a short-term investment program with the objective of maintaining a $1 net asset value (NAV). PALM has annual audited financial statements that can be obtained on their website: https://www.fl-palm.com/.
Cash and cash equivalents include cash deposits and short-term investments with original maturities of three months or less from the date of acquisition.
2. Accounts and Other Receivables
Management considers most accounts and other receivables to be fully collectible; however, the Authority has created an allowance for those where, based upon historical attempts at collection, it deems collection to be unlikely. The allowance for trade receivables as of September 30, 2025, was $75,000. All other receivables were deemed fully collectible as of September 30, 2025.
3. Investments
The Authority’s investments are reported at fair value using the quoted market price or other fair value techniques as required by the Governmental Accounting Standards Board (GASB) Statement No. 72, Fair Value Measurements (GASB 72). Fair value is defined by GASB 72 as the price that would be received to sell an asset or to transfer a liability in an orderly transaction between market participants at the measurement date. Categories within the fair value hierarchy include: Level 1 inputs are quoted prices in active markets for identical assets; Level 2 inputs are significant other observable inputs; and Level 3 are unobservable inputs.
As of September 30, 2025, the Authority reported investments at fair value. Fair value for all the Authority’s investments in debt was measured using Level 1 and Level 2 techniques. Florida PRIME is valued at amortized cost and Florida PALM is measured at fair value using NAV.
4. Leases
The Authority has entered into various lessor arrangements with tenants for the use of warehouses, terminals, offices, and land at the Authority. For certain regulated leases and short-term leases, the Authority recognizes rental income based on the provisions of the lease agreement in the statement of revenues, expenses and changes in net position.
For other lessor arrangements, the Authority recognizes a lease receivable and a deferred inflow of resources in the statement of net position. The Authority recognizes a lease receivable and a deferred inflow of resources at the commencement of the lease term, with certain exceptions for leases of assets held as investments, certain regulated leases, short-term leases and leases that transfer ownership of the underlying assets. The lease receivable is measured at the present value of the lease payments expected to be received during the lease term. The deferred inflow of resources is measured as the value of the lease receivable in addition to any payments received at or before the commencement of the lease term that relate to future periods. Lease receivable is reduced as payments are received, applying principal against receivable and interest to revenue, based on the amortization schedule. Deferred inflow is recognized as revenue on a straight-line basis over the life of the lease term.
The Authority uses the following estimates and judgments to measure the GASB 87, Leases (GASB 87) leases:
- Discount Rate: The Authority uses its incremental borrowing rate to discount the expected lease receipts to present value based on the terms of the leases.
- Lease Term: The lease term includes the non-cancelable lease period, plus:
- Periods for which the Authority has a unilateral option to extend and is reasonably certain to exercise such option, or
- Periods after an optional termination date if the Authority is reasonably certain not to exercise the termination option.
- Lease Modifications: The Authority monitors changes in circumstances that would require a remeasurement of its lease and will remeasure the lease asset and liability if certain changes occur that are expected to significantly affect the amount of the lease liability.
- Lease Receipts: Measurement of the lease receivable includes fixed payments and, as applicable, variable fixed in substance payments, residual value guarantee payments that are fixed in substance and any lease incentives payable to the lessee.
5. Prepaid Expenses
Prepaid expenses consist of payments to vendors which reflect costs applicable to future accounting periods. Prepaid expenses are recorded as expenditures over the period of their economic benefit.
6. Restricted Cash and Cash Equivalents
Debt proceeds and funds set aside for payment of revenue bonds and construction projects are classified as restricted assets on the statement of net position because their use is limited by applicable bond indentures.
7. Inventory
Inventory is stated at the lesser of cost or market using the first-in, first-out inventory method.
8. Capital Assets
Capital assets are defined by the Authority as assets with an initial cost of more than $10,000 and an estimated useful life in excess of one year. Such assets are recorded at cost, if purchased, and at acquisition value at date of gift, if donated. Major additions are capitalized while maintenance and repairs, which do not improve or extend the life of the respective assets, are charged to expense. Contributions received in aid of construction are credited to capital contributions and do not reduce the cost of the assets acquired with such contributions. Costs associated with deepening and widening the channel increase the potential service utility of the port and are recorded as a non-depreciable capital asset.
Depreciation is recognized on the straight-line method over the estimated useful lives of the assets. The following estimated useful lives are used for depreciation purposes:
| Classification | Range of Lives (Years) |
| Buildings | 30 |
| Improvements other than buildings | 5-40 |
| Equipment | 3-20 |
The Authority recognizes amortization on intangible assets as follows:
| Classification | Range of Lives (Years) |
| Computer software | 3-5 |
| Trademarks | 5 |
| Risk assessment plan | 5 |
| Master plan | 7 |
9. Deferred Outflows of Resources
In addition to assets, the statement of net position includes a separate section for deferred outflows of resources. This separate financial statement section, deferred outflows of resources, represents a consumption of net assets that applies to future periods and so will not be recognized as an outflow of resources (expenses) until that time. The Authority currently reports losses on bond refunding and items related to other post-employment benefits (OPEB) in this section.
10. Compensated Absences
The Authority’s employees earn paid time off (holiday, vacation, personal days, sick time and other absences) at varying rates depending on years of service and position. Employees accumulate hours of paid time off subject to certain limits. Upon termination, employees are paid for time off accrued but not used at their current rate of pay, (excluding sick) subject to certain limits. In accordance with GASB Statement No. 101, Compensated Absences, accumulated time off is estimated and accrued as liabilities on the financial statements to the extent that it is more likely than not that the leave will be used for time off or otherwise paid in cash or settled through noncash means.
11. Other Post-Employment Benefits (OPEB)
The Authority obtains actuarial valuation reports for its postemployment benefit plan and records the OPEB liability as required under GASB 75, Accounting and Financial Reporting for Post-Employment Benefits Other Than Pensions. Disclosure information required by GASB 75 is found in Note 3.L.
12. Unearned Revenue
Resources that do not meet the revenue recognition requirements (not earned) are recorded as unearned revenue in the statement of net position.
13. Deferred Inflows of Resources
In addition to liabilities, the statement of net position includes a separate section for deferred inflows of resources. This separate financial statement section, deferred inflows of resources, represents an acquisition of net assets that applies to a future period and so will not be recognized as an inflow of resources (revenue) until that time. The Authority currently reports items related to OPEB and leases in this section.
14. Net Position - Net Investment in Capital Assets
The net investment in capital assets component of net position consists of capital assets, net of accumulated depreciation, reduced by the outstanding balance of bonds, notes or other borrowings that are attributable to the acquisition, construction or improvements of those assets and any deferred losses on bond refunding.
15. Net Position - Restricted
The Authority’s statement of net position reports restrictions on net position that is maintained for specific purposes. The nature and purpose of the restriction represent, in accordance with legal restrictions, amounts for payment of principal and interest maturing in later years and amounts held by escrow agent for a future lease termination payment.
16. Net Position - Unrestricted
This category represents the net position of the Authority, which is not restricted for any project or other purpose.
D. Revenues and Expenses
1. Operating Revenues and Expenses
2. Grants
Grants restricted for capital acquisition and construction are recorded as capital contributions. Other grant revenue is classified as non-operating revenue. They are considered earned when all applicable eligibility requirements have been met, and it is earned by the Authority.
E. Estimates
The preparation of financial statements in conformity with accounting principles generally accepted in the United States of America (U.S. GAAP) requires management to make estimates and assumptions that affect the reported amounts of assets, deferred outflows, liabilities and deferred inflows, and disclosure of contingent assets and liabilities at the date of the financial statements, and the reported amounts of revenues and expenses during the reporting period. Actual results could differ from those estimates.
Note 2. Budgetary Information
The Authority’s Enabling Act requires adoption of an annual operating budget. The Board adopts an annual operating and capital improvement budget resolution prior to September 30, for the next ensuing fiscal year. The Authority’s budgets are prepared on the accrual basis of accounting which is consistent with U.S. GAAP. Operating budgets for the enterprise fund are based on the level of service expectations. Capital improvement projects are budgeted to provide control over authorized project expenses and ensure legal compliance.
The Authority has statutory authority to levy ad valorem taxes up to three (3) mills annually on all taxable property within the Authority’s district boundaries for operation, maintenance, and improvement of Authority facilities. The Authority has not levied property taxes since 1986 and does not expect to do so in the foreseeable future.
Note 3. Detail Notes
A. Cash and Cash Equivalents and Investments
On September 30, 2025, the carrying amount of the Authority’s recorded deposits with financial institutions was $69,338,498, and the bank balance was $69,146,886. In addition, the Authority held $500 of petty cash on September 30, 2025.
The investing of public funds in Florida PRIME is governed by Section 218.407, Florida Statutes. Florida PRIME is under the regulatory oversight of the State of Florida. This investment pool consists of bank instruments, asset-backed securities and commercial paper. The pool operates as a money market fund but is classified as an external investment pool. The dollar weighted average days to maturity of Florida PRIME was 47 days as of September 30, 2025. On September 30, 2025, the Authority had $56,333,300 invested in Florida PRIME.
As of September 30, 2025, cash equivalents placed in money market accounts with PALM was $102,894,058. The dollar weighted average days to maturity of Florida PALM was 43 days as of September 30, 2025.
Florida Statutes, Chapter 280, Florida Security for Public Deposit Act (the Act) prescribes that the deposit authority of the Authority’s policy conforms to state statute. Deposits whose value exceeds the limits of the Federal Depository Insurance Corporation (FDIC) are entirely insured or collateralized pursuant to the Act. Under the Act, every qualified public depository shall deposit with the Florida Treasury, eligible collateral of the depository to be held subject to his or her order. The Florida Treasurer, by rule, shall establish minimum required collateral pledging levels. The pledging level may range from 25% to 200% of the average monthly balance of public deposits with an approved financial institution. The Public Deposit Security Trust Funds (Florida PRIME and PALM) have a procedure to allocate and recover losses in the event of default or insolvency. The Authority depositaries at year-end were designated as qualified public depositories. All bank balances were covered by the FDIC and the banks’ participation in the Act.
On September 30, all cash and cash equivalents were as follows:
| Deposits with financial institutions | $ 69,338,498 |
| Deposits with Florida PRIME | 56,333,300 |
| Deposits with PALM | 102,894,058 |
| Total current assets | $ 228,565,856 |
| Reconciliation to the statement of net position: | |
| Cash and cash equivalents, current | $ 215,273,076 |
| Cash and cash equivalents, noncurrent | 13,292,780 |
| Total cash and cash equivalents | $ 228,565,856 |
Credit Risk
The Authority’s investment policy addresses credit risk by restricting the types of investments in which it can invest, consistent with limitations defined in Florida Statutes 218.415.
Credit risk is the risk that a security or a portfolio will lose some or all its value due to a real or perceived change in the ability of the issuer to repay its debt. This risk is measured by the assignment of a rating by a nationally recognized statistical rating organization. The Authority’s investment policy permits the following investments, which are limited to credit quality ratings from nationally recognized rating agencies as described below:
- Commercial paper of any United States company or foreign company domiciled in the United States that is rated, at the time of purchase, “Prime-1” by Moody’s and “A-1” by Standard & Poor’s (prime commercial paper), or equivalent, as provided by two nationally recognized rating agencies. If the commercial paper is backed by a letter of credit (LOC), the long-term debt of the LOC provider must be rated “A” or better by at least two nationally recognized rating agencies.
- Local Intergovernmental Pools with the highest fund quality rating of AAAm or equivalent. Florida PRIME and PALM were rated AAAm by Standard & Poor’s on September 30, 2025.
- Corporate bonds issued by corporations organized and operating within the United States or by depository institutions licensed by the United States that have a long-term debt rating, at the time of purchase, at a minimum “A” by Moody’s and a minimum long-term debt rating of “A” by Standard & Poor’s, or equivalent as provided by two nationally recognized rating agencies.
Custodial Credit Risk
For an investment, custodial credit risk is the risk that, in the event of the failure of the counterparty, the Authority will not be able to recover the value of its investments or collateral securities that are in the possession of an outside party.
The Authority’s investment policy requires securities to be held by a third-party custodian and be properly designated as an asset of the Authority and held in the Authority’s name. As of September 30, 2025, the Authority’s investment portfolio was held with a third-party custodian and designated as Authority assets and held in the Authority’s name, as required by the Authority’s investment policy.
Interest Rate Risk
Fair Value Measurements
| Fair Value Measurements Using | ||||
| Investments | Amount | Quoted Prices in Active Market for Identical Assets (Level 1) | Significant Other Observable Inputs (Level 2) | Significant Unobservable Inputs (Level 3) |
| Investments by Fair Value Level: | ||||
| U.S. Government Securities | $21,954,767 | $18,746,682 | $3,208,085 | $- |
| Corporate Issues | 19,639,009 | - | 19,639,009 | - |
| Municipal Issues | 1,615,559 | - | 1,615,559 | - |
| Total Investments by Fair Value Level | $43,209,335 | $18,746,682 | $24,462,653 | $- |
U.S. Government securities totaling $18.7 million in fiscal year 2025 are classified in Level 1 of the fair value hierarchy and are valued using quoted prices in active markets.
U.S. Government securities totaling $3.2 million, corporate issues totaling $19.6 million, and municipal issues totaling $1.6 million in fiscal year 2025 are classified in Level 2 of the fair value hierarchy and are valued using matrix pricing techniques maintained by various pricing vendors. Matrix pricing is used to value securities based on the securities’ relationship to benchmark quoted prices. The Authority has no investments classified in Level 3.
Concentration of Credit Risk
The Authority’s investment policy does not specifically address the concentration of credit risk. However, the policy indicates that investments should be diversified to control the risk of loss resulting from overconcentration of assets.
On September 30, 2025, the Authority’s investments had the following maturities and credit ratings:
| Investment Type | Amount | Investment Maturities (in years) | Rating | ||
|---|---|---|---|---|---|
| Less than 1 | 1-5 | 6-10 | |||
| Investments | |||||
| U.S. Government Securities | $21,954,767 | $704,142 | $21,173,047 | $77,578 | AAA |
| Corporate Issues | 19,639,009 | 592,865 | 19,046,144 | - | A-AAA |
| Municipal Issues | 1,615,559 | - | 1,615,559 | - | AAA |
| Total | $43,209,335 | $1,297,007 | $41,834,750 | $77,578 | |
B. Restricted Cash and Cash Equivalents
| Debt service reserve | $ 2,978,641 |
| Bond reserve | 13,104,047 |
| Total | $ 16,082,688 |
C. Leases
The Authority has entered into various lessor arrangements with tenants for the use of warehouses, terminals, offices and land at the port. For the purpose of GASB 87, the lessor leases have been categorized as follows:
- GASB 87 – Included Leases
- GASB 87 – Excluded – Regulated Leases
- GASB 87 – Excluded – Short-Term Leases
1. GASB 87 Leases - Included
The incremental borrowing rates ranging from 3.00% to 3.13% are used to discount the expected lease receipts to present value. As of September 30, 2025, lease receivable is $38.9 million ($3.9 million current assets; $35 million noncurrent assets) relating to fifty-four (54) leases, with interest income of $1.2 million related to the lease payments received and included in fees and charges for services on the statement of revenues, expenses and changes in net position.
As of September 30, 2025, deferred inflows are $35.9 million, and recognized revenues are $4.5 million.
Future payments included in the measurement of the lease receivable, as of September 30, 2025, are as follows:
| Year/Period | Principal | Interest | Total |
|---|---|---|---|
| 2026 | $ 3,799,641 | $ 1,054,653 | $ 4,854,294 |
| 2027 | 3,495,785 | 944,886 | 4,440,671 |
| 2028 | 3,233,938 | 848,818 | 4,082,756 |
| 2029 | 3,226,975 | 754,406 | 3,981,381 |
| 2030 | 3,106,193 | 658,059 | 3,764,252 |
| 2031 to 2035 | 7,037,954 | 2,379,732 | 9,417,686 |
| 2036 to 2040 | 2,612,712 | 1,902,965 | 4,515,677 |
| 2041 to 2045 | 1,889,931 | 1,682,260 | 3,572,191 |
| 2046 to 2050 | 2,003,210 | 1,509,578 | 3,512,788 |
| 2051 to Thereafter | 8,592,975 | 9,176,813 | 17,769,788 |
| Total | $ 38,999,314 | $ 20,912,170 | $ 59,911,484 |
2. GASB 87 Leases - Excluded - Regulated Leases and Short-Term Leases
| Years Ending September 30: | ||
|---|---|---|
| 2026 | $ 51,068,662 | $ 51,068,662 |
| 2027 | 56,794,963 | 56,794,963 |
| 2028 | 51,916,846 | 51,916,846 |
| 2029 | 46,620,217 | 46,620,217 |
| 2030 | 52,689,113 | 52,689,113 |
| 2031 to 2035 | 265,384,822 | 265,384,822 |
| 2036 to 2040 | 253,702,557 | 253,702,557 |
| 2041 to 2045 | 136,993,614 | 136,993,614 |
| 2046 to 2050 | 27,197,010 | 27,197,010 |
| 2051 to 2055 | 17,608,743 | 17,608,743 |
| 2056 to 2060 | 11,927,887 | 11,927,888 |
| Total | $ 971,904,434 | $ 971,904,435 |
3. Bluepoints Leases – deposits in escrow
D. Capital Assets
Capital asset activity for the year ended September 30, was as follows:
| Balance October 1, 2024 | Transfers/ Increases | Transfers/ Decreases | Balance September 30, 2025 | |
|---|---|---|---|---|
| Capital assets, not being depreciated/amortized: | ||||
| Land | $ 5,470,630 | $ - | $ - | $ 5,470,630 |
| Construction in progress | 123,323,638 | 80,132,942 | (95,516,185) | 107,940,395 |
| Total capital assets, not being depreciated/amortized | 128,794,268 | 80,132,942 | (95,516,185) | 113,411,025 |
| Capital assets, being depreciated/amortized: | ||||
| Buildings | 279,019,008 | 68,704,539 | (217,657) | 347,505,890 |
| Improvements other than buildings | 765,890,494 | 16,069,297 | (59,314) | 781,900,477 |
| Equipment | 138,422,651 | 10,808,326 | (14,415,813) | 134,815,164 |
| Intangible assets | 21,987,752 | - | - | 21,987,752 |
| Total capital assets being depreciated/amortized | 1,205,319,905 | 95,582,162 | (14,692,784) | 1,286,209,283 |
| Less accumulated depreciation/amortization for: | ||||
| Buildings | (110,967,962) | (15,300,119) | 201,517 | (126,066,564) |
| Improvements other than buildings | (361,874,919) | (25,018,758) | 47,091 | (386,846,586) |
| Equipment | (100,282,994) | (8,053,386) | 14,407,676 | (93,928,704) |
| Intangible assets | (17,224,986) | (1,220,748) | - | (18,445,734) |
| Total accumulated depreciation/amortization | (590,350,861) | (49,593,011) | 14,656,284 | (625,287,588) |
| Total capital assets, being depreciated/amortized, net | 614,969,044 | 45,989,151 | (36,500) | 660,921,695 |
| Capital assets, net | $ 743,763,312 | $ 126,122,093 | $ (95,552,685) | $ 774,332,720 |
Intangible assets include computer software, a trademark, and risk and port master plan.
E. Accounts Payable and Accrued Expenses
Accounts payable and accrued expenses are comprised of the following as of September 30:
| Accounts and contracts payable | $ 25,038,419 |
| Retainage payable | 3,082,144 |
| Accrued payroll and employee benefits | 1,682,743 |
| $ 29,803,306 |
F. Other Liabilities
G. Revenue Bonds and Direct Borrowing Bonds
Revenue bonds are bonds that are offered for public sale. Direct borrowing bonds are bonds negotiated between the Authority and a bank. The revenue bonds are secured by and payable from the gross operating revenues of the Authority. The proceeds of these issues were used for capital improvements and refunding certain outstanding issues of the Authority.
The resolutions applicable to the revenue bonds require the establishment of various bond principal and interest-sinking funds and reserve accounts with various requirements for deposits. These requirements have been met for the fiscal year ended September 30, 2025. Premiums associated with bonds are amortized over the term of the debt issue.
The direct placement debt includes an event of default with finance-related consequences. An event of default is considered to occur if the Authority fails to make debt service payments on the direct placement debt, or defaults on other Authority debt obligations. In the event of default, the direct placement debt includes a default rate of interest that will increase by 6% - 8% points in excess of the prime rate as defined in the bond documents.
A summary of long-term debt on September 30, 2025, is as follows:
| Revenue Bonds | |
| Port Improvement and Refunding Revenue Bonds, Series 2016C | $ 31,540,000 |
| Port Improvement Revenue Bonds, Series 2016D | 27,145,000 |
| Port Improvement Revenue Bonds, Series 2018A | 44,995,000 |
| Port Improvement Revenue Bonds, Series 2018B | 30,000,000 |
| Subtotal revenue bonds | 133,680,000 |
| Direct Borrowing Bonds | |
| Port Revenue Refunding Bonds, Series 2016A | 15,295,000 |
| Port Revenue Refunding Bonds, Series 2016B | 27,600,000 |
| Port Improvement Revenue Bonds, Series 2018C | 30,835,000 |
| Port Revenue Refunding Bonds, Series 2019A | 3,558,000 |
| Port Revenue Refunding Bonds, Series 2019B | 6,126,000 |
| Port Revenue Refunding Bonds, Series 2019C | 44,677,000 |
| Port Revenue Refunding Bonds, Series 2019D | 27,469,000 |
| Port Improvement Revenue Bonds, Series 2020A | 29,150,000 |
| 184,710,000 | |
| Total revenue and direct borrowing bonds | 318,390,000 |
| Plus: unamortized premiums | 4,514,014 |
| Less: current maturities | (17,694,000) |
| Revenue bonds and direct borrowing bonds, less current portion | $ 305,210,014 |
PORT REVENUE REFUNDING BONDS, SERIES 2016A
On May 26, 2016, the Authority issued Port Revenue Refunding Bonds, Series 2016A (Series 2016A), in the principal amount of $24,070,000: (i) to finance various cruise terminal improvements and other capital improvements and other capital investments previously financed using short-term funds, and (ii) to pay bond issuance costs. Gross revenues are pledged for repayment of these bonds.
The Series 2016A bonds bear interest at a fixed rate of 2.35% per annum, payable semiannually on June 1 and December 1. The principal is due annually beginning with a June 1, 2022, amount of $2,100,000, and a final payment of $2,695,000 in 2031.
PORT REVENUE REFUNDING BONDS, SERIES 2016B
On August 25, 2016, the Authority issued Port Revenue Refunding Bonds, Series 2016B (Series 2016B), in the principal amount of $38,000,000: (i) to finance various cruise terminal improvements and other capital investments, a portion of which may have been previously financed using short-term funds, and (ii) to pay bond issuance costs. Gross revenues are pledged for repayment of these bonds.
The Series 2016B bonds bear interest at a fixed rate of 2.19% per annum, payable semiannually on June 1 and December 1. Principal is due annually beginning with a June 1, 2022, amount of $1,775,000, and a final payment of $5,040,000 in 2031.
PORT IMPROVEMENT AND REVENUE REFUNDING BONDS, SERIES 2016C
On November 15, 2016, the Authority issued Port Improvement and Revenue Refunding Bonds, Series 2016C (Series 2016C), in the principal amount of $37,450,000: (i) to refund the Authority’s $16,915,000 Port Revenue Refunding Bonds, Series 2006A, in which the outstanding amount was $9,760,000 and was redeemed on December 20, 2016, (ii) to currently refund all of the Authority’s Port Revenue Bonds Series 2006B in the amount of $1,330,000, (iii) to finance various cruise terminal improvements and a centralized maintenance and processing warehouse, and (iv) to pay bond issuance costs. Gross revenues are pledged for repayment of these bonds.
The Series 2016C bonds bear interest at rates ranging from 3.00% to 5.00% per annum, payable semiannually on June 1 and December 1. The principal is due annually beginning with a June 1, 2017, amount of $315,000, and a final payment of $2,650,000 in 2046.
The Series 2016C bonds are subject to redemption prior to their respective dates of maturity, at any time, on or after June 1, 2026, at the option of the Authority, in whole or in part, at redemption price equal to 100% of the principal amount of the Series 2016C bonds to be redeemed, plus accrued interest to the redemption date.
PORT IMPROVEMENT REVENUE BONDS, SERIES 2016D
On November 15, 2016, the Authority issued Port Improvement Revenue Bonds, Series 2016D (Series 2016D), in the principal amount of $27,145,000: (i) to finance an auto processing facility and vehicle staging area with roadway improvements, and (ii) to pay bond issuance costs. Gross revenues are pledged for repayment of these bonds.
The Series 2016D bonds bear interest at rates ranging from 4.494% to 4.654% per annum, payable semiannually on June 1 and December 1. The principal is due annually, beginning with a June 1, 2032, amount of $1,300,000, and a final payment of $2,440,000 in 2046.
The Series 2016D bonds are subject to redemption prior to their respective dates of maturity, at any time, on or after June 1, 2026, at the option of the Authority, in whole or in part, at redemption price equal to 100% of the principal amount of the Series 2016D bonds to be redeemed, plus accrued interest to the redemption date.
PORT IMPROVEMENT REVENUE BONDS, SERIES 2018A
On December 13, 2018, the Authority issued Port Improvement Revenue Bonds, Series 2018A (Series 2018A), in the principal amount of $44,995,000: (i) to finance the construction of a cruise terminal (the 2018 Project – Cruise Terminal), and (ii) to pay bond issuance costs. Gross revenues are pledged for repayment of these bonds.
The Series 2018A bonds bear interest at a rate of 5% per annum, payable semiannually on June 1 and December 1. The principal is due annually beginning on June 1, 2039, with an amount of $5,965,000, and a final payment of $4,440,000 in 2045.
The Series 2018A bonds are subject to redemption prior to their respective dates of maturity, at any time, on or after June 1, 2028, at the option of the Authority, in whole or in part, at redemption price equal to 100% of the principal amount of the Series 2018A bonds to be redeemed, plus accrued interest to the redemption date.
PORT IMPROVEMENT REVENUE BONDS, SERIES 2018B
On December 13, 2018, the Authority issued Port Improvement Revenue Bonds, Series 2018B (Series 2018B), in the principal amount of $30,000,000: (i) to finance the construction of a parking garage (the 2018 Project – Parking Garage), and (ii) to pay bond issuance costs. Gross revenues are pledged for repayment of these bonds.
The Series 2018B bonds bear interest at a rate of 5% per annum, payable semiannually on June 1 and December 1. The principal is due annually beginning with a June 1, 2045, amount of $3,550,000, and a final payment of $9,250,000 in 2048.
The Series 2018B bonds are subject to redemption prior to their respective dates of maturity, at any time, on or after June 1, 2028, at the option of the Authority, in whole or in part, at redemption price equal to 100% of the principal amount of the Series 2018B bonds to be redeemed, plus accrued interest to the redemption date.
PORT IMPROVEMENT REVENUE BONDS, SERIES 2018C
On December 21, 2018, the Authority issued Port Improvement Revenue Bonds, Series 2018C (Series 2018C), in the principal amount of $37,000,000: (i) to finance the construction of a cruise terminal (the 2018 Project – Cruise Terminal), and (ii) to pay bond issuance costs. Gross revenues are pledged for repayment of these bonds.
The Series 2018C bonds bear interest at a rate of 3.41% per annum, payable semiannually on June 1 and December 1. The principal is due annually, beginning with a June 1, 2020, amount of $945,000, and a final payment of $4,970,000 in 2038.
The Series 2018C bonds are subject to redemption prior to their respective dates of maturity, at any time, on or after December 1, 2028, at the option of the Authority, in whole or in part, at redemption price equal to 100% of the principal amount of the Series 2018C bonds to be redeemed, plus accrued interest to the redemption date.
PORT REVENUE REFUNDING BONDS, SERIES 2019A
On December 3, 2019, the Authority issued Port Revenue Refunding Bonds, Series 2019A (Series 2019A), in the principal amount of $10,106,000: (i) to refund the Port Improvement Revenue Bonds, Series 2013 in which the outstanding amount was $10,084,000, and (ii) to pay bond issuance costs. Gross revenues are pledged for repayment of these bonds. The refunding reduces the Authority's aggregate debt service payments by $665,801, resulting in a present value savings of $574,787.
The Series 2019A bonds bear interest at a fixed rate of 1.76% per annum, payable semi-annually on June 1 and December 1. The principal is due semi-annually beginning with June 1, 2020, an amount of $1,019,000, and a final payment of $603,000 in 2028.
PORT REVENUE REFUNDING BONDS, SERIES 2019B
On December 3, 2019, the Authority issued Port Revenue Refunding Bonds, Series 2019B (Series 2019B), in the principal amount of $32,404,000:
(i) to refund the Port Improvement Revenue Bonds, Series 2010 in which the outstanding amount was $14,513,849,
(ii) to refund the Port Improvement Revenue Bonds, Series 2013A in which the outstanding amount was $17,829,000, and
(iii) to pay bond issuance costs. Gross revenues are pledged for repayment of these bonds. The refunding reduces the system's aggregate debt service payments by $1,665,351, resulting in a present value savings of $1,416,788.
The Series 2019B bonds bear interest at a fixed rate of 1.73% per annum, payable semi-annually on June 1 and December 1. Principal is due semi-annually beginning with a June 1, 2020, amount of $5,337,000, and a final payment of $1,039,000 in 2028.
PORT REVENUE REFUNDING BONDS, SERIES 2019C
On December 3, 2019, the Authority issued Port Revenue Refunding Bonds, Series 2019C (Series 2019C), in the principal amount of $56,947,000: (i) to refund $56,843,500 of the Port Improvement Revenue Bonds, Series 2014, and (ii) to pay bond issuance costs. Gross revenues are pledged for repayment of these bonds. The refunding reduces the Authority’s aggregate debt service payments by $8,326,022, resulting in a present value savings of $7,271,603.
The Series 2019C bonds bear interest at a fixed rate of 1.87% per annum, payable semi-annually on June 1 and December 1. The principal is due semi-annually beginning with a June 1, 2020, amount of $1,082,000, and a final payment of $3,066,000 in 2034.
The Series 2019C bonds are subject to redemption prior to their respective dates of maturity, at any time, on or after December 1, 2029, at the option of the Authority, in whole or in part, at redemption price equal to 100% of the principal amount of the Series 2019C bonds to be redeemed, plus accrued interest to the redemption date.
PORT REVENUE REFUNDING BONDS, SERIES 2019D
On December 3, 2019, the Authority issued Port Revenue Refunding Bonds, Series 2019D (Series 2019D), in the principal amount of $35,047,000: (i) to refund $34,980,707 of the Port Improvement Revenue Bonds, Series 2014, and (ii) to pay bond issuance costs. Gross revenues are pledged for repayment of these bonds. The refunding reduces the Authority's aggregate debt service payments by $5,038,911, resulting in a present value savings of $4,400,523.
The Series 2019D bonds bear interest at a fixed rate of 1.89% per annum, payable semi-annually on June 1 and December 1. The principal is due semi-annually beginning with a June 1, 2020, amount of $657,000, and a final payment of $1,874,000 in 2034.
The Series 2019D bonds are subject to redemption prior to their respective dates of maturity, at any time, on or after December 1, 2029, at the option of the Authority, in whole or in part, at redemption price equal to 100% of the principal amount of the Series 2019D bonds to be redeemed, plus accrued interest to the redemption date.
PORT IMPROVEMENT REVENUE BONDS, SERIES 2020A
On March 11, 2020, the Authority issued Port Improvement Revenue Bonds, Series 2020A (Series 2020A), in the principal amount of $36,000,000 to finance the construction of cruise terminal improvements. Gross revenues are pledged for repayment of these bonds.
The Series 2020A bonds bear interest at a fixed rate of 2.47% per annum, payable semi-annually on June 1 and December 1. The principal is due semi-annually beginning with a June 1, 2021, amount of $725,000, and a final payment of $1,155,000 in 2040.
The Series 2020A bonds are subject to redemption prior to their respective dates of maturity, at any time, on or after March 11, 2025, at the option of the Authority, in whole or in part, at redemption price equal to 100% of the principal amount of the Series 2020A bonds to be redeemed, plus accrued interest to the redemption date.
FUTURE MATURITIES
Future maturities requirements for all outstanding revenue bonds payable, as of September 30, 2024, are as follows:
| Revenue Bonds | Direct Borrowing Bonds | ||||
|---|---|---|---|---|---|
| Principal | Interest | Principal | Interest | Total | |
| 2026 | $ 780,000 | $ 6,230,465 | $ 16,516,000 | $ 4,565,656 | $ 28,142,121 |
| 2026 | 825,000 | 6,241,465 | 16,869,000 | 4,210,882 | 28,146,347 |
| 2027 | - | 6,200,215 | 18,344,000 | 3,848,204 | 28,392,419 |
| 2028 | - | 6,200,215 | 18,760,000 | 3,453,072 | 28,413,287 |
| 2029 | - | 6,200,215 | 19,450,000 | 3,046,158 | 28,696,373 |
| 2030 to 2034 | 8,915,000 | 30,667,374 | 79,412,000 | 9,225,677 | 128,220,051 |
| 2035 to 2039 | 23,420,000 | 27,845,445 | 29,580,000 | 2,660,688 | 83,506,133 |
| 2040 to 2044 | 56,110,000 | 18,977,462 | 2,295,000 | 42,608 | 77,425,070 |
| 2045 to 2048 | 44,410,000 | 5,059,552 | - | - | 49,469,552 |
| $ 134,460,000 | $ 113,622,408 | $ 201,226,000 | $ 31,052,945 | $ 480,411,353 | |
Authority.
H. Lines of Credit
PNC Bank
As of September 30, 2024, the Authority has an agreement with PNC Bank for a line of credit not to exceed $30,000,000 with a maturity date of December 15, 2025. This line of credit is used to provide bridge financing for capital projects. The taxable interest rate is the one-month term Secured Overnight Financing Rate (SOFR) plus 0.63%. The tax-exempt rate is 79% of one-month term SOFR, plus 0.56%. The line of credit balance on September 30, 2024, was $16,000,000.
Truist Bank
As of September 30, 2024, the Authority has an agreement with Truist Bank for a line of credit not to exceed $20,000,000 with a maturity date of October 10, 2025. This line of credit is used to provide bridge financing for capital projects. The taxable interest rate is the one-month term SOFR plus 0.65%. The line of credit balance on September 30, 2024, was $5,000,000.
I. Changes in Long-Term Liabilities
Long-term liability activity for the year ended September 30, 2024, was as follows:
| Balance October 1, 2023 | Additions | Reductions | Balance September 30, 2024 | Due Within One Year | |
|---|---|---|---|---|---|
| Revenue bonds | $ 135,205,000 | $ - | $ (745,000) | $ 134,460,000 | $ 780,000 |
| Direct borrowing bonds | 217,391,000 | - | (16,165,000) | 201,226,000 | 16,516,000 |
| Unamortized bond premiums | 4,999,979 | - | (242,982) | 4,756,997 | - |
| Lines of credit | 21,000,000 | - | - | 21,000,000 | - |
| Compensated absences | 1,672,476 | 5,506 * | - | 1,677,982 | - |
| Other liabilities | 7,198,955 | 1,232,467 | (4,430,900) | 4,000,522 | 2,591,415 |
| Long-term liabilities | $ 387,467,410 | $ 1,237,973 | $ (21,583,882) | $ 367,121,501 | $ 19,887,415 |
J. Restricted Net Position
The following schedule lists the amounts of net position that are restricted as of September 30, 2024, in accordance with the provisions of the respective bond indentures. These amounts represent restricted assets, less certain current liabilities payable from restricted assets included in the various debt service, reserve, bond and interest sinking fund accounts.
| Bond Reserve | |
| Series 2016C | $ 22,715,498 |
| Series 2016D | 2,199,813 |
| Series 2018A | 5,102,166 |
| Series 2018B | 2,767,145 |
| Total debt service restrictions | $ 13,104,047 |
K. Defined Contribution Plan
Effective January 1, 1996, the Authority adopted Resolution 96-12, pursuant to 95-338 Laws of Florida, whereby the Authority revoked its participation in the Florida Retirement System and established the Canaveral Port Authority Defined Contribution Plan and Trust (the Plan) for employees hired after January 1, 1996.
The Plan is administered by the Authority as a Qualified Retirement Plan as defined by Section 401 (a) of the Internal Revenue Code. Plan provisions and contribution requirements are established and may be amended by the Board. The Authority contributes 10.77% of the employees' eligible compensation to the Plan; employee contributions to the Plan are not permitted. The amount of covered payroll by the Plan for the year ended September 30, 2024, was $20,933,098. The amount of retirement expense related to the Plan for the year ended September 30, 2024, was $2,259,692.
L. Other Post-Employment Benefits (OPEB)
(a) Description of OPEB Plans
Plan description: The Authority administers a single employer defined benefit healthcare plan (the Healthcare Plan) that provides health care benefits, including medical coverage and prescription drug benefits, to its employees and their eligible dependents. Pursuant to Section 112.0801 Florida Statutes, the Authority is required to provide eligible retirees (as defined in the Authority’s ordinances) with the opportunity to participate in this Healthcare Plan at the same cost that is applicable to active employees.
Employees who are active participants in the Healthcare Plan at the time of retirement and are either aged 62 with a completion of six years of service or have 30 years of service are eligible to receive benefits. Below is a summary of the Healthcare Plan’s membership as of September 30:
| Active | 225 |
| Inactive, receiving benefits | 1 |
| Total membership | 226 |
The Board can only amend benefit provisions. The Board approves the Authority’s annual budget and, therefore, indirectly approves the annual costs associated with the Healthcare Plan. The Authority has not established a trust fund for the Healthcare Plan and there are no assets accumulated in a trust. The Authority does not issue standalone financial statements for the Healthcare Plan. All financial information related to the Healthcare Plan is accounted for in the Authority’s basic financial statements.
For the year ended September 30, 2025, the amount of benefits paid by the Authority for the Healthcare Plan was $52,084.
(b) Measurement of Total OPEB Liability
| Measurement date | 09/30/2024 |
| Actuarial valuation date | 10/01/2023 |
| Salary increases rate | 3.00% per annum |
| Healthcare cost trend rate | 8% for 2024 graded down by 0.5% per year to 5.0% in 2029/30 |
| Discount rate | 4.06%; based on the return on the S&P Municipal Bond 20-year High Grade Index |
| Mortality tables used | PUB-2010 Combined Mortality Table with fully generational improvements in mortality using Scale MP-2020 |
Multiple healthcare cost trend rate assumptions were used for different benefit components and participant groups (pre-65 and post-65 age groups). The current rates used to calculate the total OPEB liability as of September 30, 2025, are as follows:
| Year | |
|---|---|
| 2024 to 2025 | 7.5% |
| 2025 to 2026 | 7.0% |
| 2026 to 2027 | 6.5% |
| 2027 to 2028 | 6.0% |
| 2028 to 2029 | 5.5% |
| 2029 to 2030 | 5.0% |
As of the measurement date, September 30, 2025, the Authority did not have any assets accumulated in a trust that was dedicated to providing benefits to Healthcare Plan members.
Since prior measurement date, the discount rate was decreased from 4.91% per annum to 4.06% per annum; the healthcare cost trend rates were increased from 6.5% for the 2023/24 fiscal year graded down to 5.00% for the 2026/27 and later fiscal years to the amounts shown; the implied subsidy for the retiree at age 62 for the 2023/24 fiscal year was changed from $482 (low plan) or $375 (high plan) to $550 or $500, respectively; and the implied subsidy for the retiree’s spouse at age 62 for the 2023/24 fiscal year was changed from $562 (low plan) or $401 (high plan) to $650 or $550, respectively.
(c) Changes in Total OPEB Liability
Changes in the Healthcare Plan total OPEB liability for the fiscal year ending September 30, 2025, based on the measurement date, are as follows:
| Year | |
| 2024 to 2025 | 7.5% |
| 2025 to 2026 | 7.0% |
| 2026 to 2027 | 6.5% |
| 2027 to 2028 | 6.0% |
| 2028 to 2029 | 5.5% |
| 2029 to 2030 | 5.0% |
(d) OPEB Expense
For the year ended September 30, 2025, the amount of OPEB expense recognized by the Authority was a credit of $166,285.
(e) OPEB Deferred Outflows and Inflows of Resources
For the year ended September 30, 2025, the Authority reported deferred outflows of resources and deferred inflows of resources related to OPEB from the following sources:
| 2025 | |||
Deferred Outflows of Resources | Deferred Inflows of Resources | ||
| Demographic gain/loss | $ 85,105 | $ 481,269 | |
| Assumption changes | 711,604 | 752,841 | |
| Total | $ 796,709 | $ 1,234,110 | |
Amounts reported as deferred outflows of resources and deferred inflows of resources related to OPEB will be recognized in pension expense as follows:
| Years Ending September 30: | Outflows (Inflows) |
|---|---|
| 2026 | $ (58,320) |
| 2027 | (58,320) |
| 2028 | (58,320) |
| 2029 | (58,320) |
| 2030 | (58,320) |
| Thereafter | (145,801) |
$ (437,401) |
(f) Sensitivity of the Total OPEB Liability to Changes in the Healthcare Cost Trend Rate and Discount Rate
i) Healthcare Cost Trend Sensitivity
The following presents the total OPEB liability for the Healthcare Plan, calculated using healthcare cost trend rates as of September 30, 2025, as well as what the total OPEB liability would be if it were calculated using healthcare cost trend rates that are one percentage point lower or one percentage point higher than the current rates, as of the Healthcare Plan’s measurement date:
| Total OPEB Liability | ||||
| Trend Rate | 1% Decrease | Current Rate | 1% Increase | |
| As of September 30, 2025 | 8.00% | $ 1,813,016 | $ 2,078,753 | $ 2,399,657 |
ii) Discount Rate Sensitivity
The discount rate was based on the return on the S&P Municipal Bond 20-year High Index as of the measurement date. The following presents the total OPEB liability of the Authority, as well as what the Authority’s total OPEB liability would be if it were calculated using a discount rate that is one percentage point lower or one percentage point higher than the current discount rate:
| Discount Rate | 1% Decrease | Current Rate | 1% Increase | |
| As of September 30, 2025 | 4.06% | $ 2,304,205 | $ 2,078,753 | $ 1,847,073 |
M. Major Customers
Gross revenues from the top three companies totaled $47,034,144, $37,038,906 and $25,747,846 in 2025, respectively. The top three are cruise companies. On September 30, 2025, the outstanding trade accounts receivable balances of these three companies amounted to $1,117,741, $3,815,381 and $626,665 respectively.
N. Risk Management
The Authority purchases commercial insurance to cover the risk of loss for general liability, property and casualty, comprehensive crime and flood and fire. The Authority is exposed to various risks and losses related to alleged torts; theft of, damage to, and destruction of assets; errors and omissions; injuries to employees; and natural disasters. The Authority manages the exposure to these risks through the purchase of commercial insurance. In the past three years, there have been no claims that have exceeded the Authority’s insurance coverage.
O. Concentration – Collective Bargaining Unit
Substantially all the Authority’s non-management public safety, parking operations, enforcement, support, maintenance, supply and safety employees are covered by a collective bargaining agreement, which is in effect through September 30, 2028.
Note 4. Commitments and Contingencies
P. Capital Contributions
For the year ended September 30, 2025, the Authority recognized capital contributions of $2,290,263, composed primarily of federal and state grants used for various capital projects.
A. Construction
Commitments for the repair, modification, improvements, materials and new construction of Authority owned property on September 30, 2025, totaled $205,710,563.B. Litigation
The Authority is named as a defendant in various lawsuits. The outcome of the lawsuits are not determinable currently. It is the opinion of management and of the Authority’s legal counsel that the resolution of these matters will not have a material adverse effect on the financial condition of the Authority.
C. Grants Programs
The Authority participates in federal, and state assisted grant programs that are subject to review and audit by the grantor agencies. Entitlement to these resources is conditional upon compliance with the terms and conditions of the grant agreements and applicable federal and state regulations. Any disallowance resulting from a regulatory audit may become a liability to the Authority. Assessments from such audits, if any, are recorded when the amounts of such assessments become reasonably determinable.
Note 5. Future Accounting Pronouncements
GASB has issued the following statements that will become effective in future years. Management has not yet determined the effects, if any, of these statements on the financial statements of the Authority.
- GASB Statement No. 103, Financial Reporting Model Improvements, was issued in April 2024, and will be effective for the Authority in fiscal year 2026. The objective of this statement is to improve key components of the financial reporting model to enhance its effectiveness in providing information that is essential for decision making and assessing a government’s accountability. This statement also addresses certain application issues.
- GASB Statement No. 104, Disclosure of Certain Capital Assets, was issued in September 2024, and will be effective for the Authority in fiscal year 2026. The objective of this statement is to provide the users of government financial statements with essential information about certain types of capital assets. This statement requires certain types of capital assets to be disclosed separately in the capital asset note disclosures required by GASB Statement No. 34, Basic Financial Statements and Management Discussions and Analysis for State and Local Governments. This statement also requires additional disclosures for capital assets held for sale.
- GASB issued Statement No. 105, Subsequent Events, was issued in December 2025, and will be effective for the Authority in fiscal year 2027. The objective of this Statement is to improve the financial reporting requirements for subsequent events, thereby enhancing consistency in their application and better meeting the information needs of financial statement users. This Statement defines subsequent events, as well as outlines when such events should be disclosed.
Management adopted the following GASB statements in the current year.
- GASB Statement No. 101, Compensated Absences was issued in June 2022. The statement improves the information needs of financial statement users by updating the recognition and measurement guidance for compensated absences. That objective is achieved by aligning the recognition and measurement guidance under a unified model and by amending certain previously required disclosures. The requirements of this statement were effective for the Authority beginning October 1, 2024. See Note 6 for further information on the implementation of this GASB statement.
- GASB issued Statement No. 102, Certain Risk Disclosures was issued in December 2023. The requirements of this statement are effective for reporting periods beginning after June 15, 2024, and require state and local governments to disclose information about concentrations and constraints that make them vulnerable to a significant adverse impact. The adoption of the statement in the current year did not have a material impact on the financial statements for the year ended.
Note 6. Restatement – Implementation of GASB Statement No. 101, Compensated Absences
Effective October 1, 2024, the Authority implemented GASB Statement No. 101, Compensated Absences, which updates the recognition and measurement guidance for compensated absences and requires that liabilities for compensated absences be recognized for (1) leave that has not been used and (2) leave that has been used but not yet paid in cash or settled through noncash means.
This implementation increased beginning compensated absences liability and decreased the beginning net position as shown below:
| Compensated Absences | Net Position | |
| Balance October 1, 2024, as previously reported | $ 1,677,982 | $ 611,483,448 |
| Change to implement GASB | 101 890,070 | (890,070) |
| Balance October 1, 2024, as restated | $ 2,568,052 | $ 610,593,378 |
Schedule of Changes in Total OPEB Liability (Unaudited)
Last Ten Fiscal Years*
| Fiscal Years Ended September 30, | 2025 | 2024 | 2023 | 2022 | 2021 | 2020 | 2019 | 2018 |
|---|---|---|---|---|---|---|---|---|
| Total OPEB Liability | ||||||||
| Service cost | $ 286,793 | $ 155,888 | $ 142,621 | $ 180,797 | $ 352,677 | $ 178,370 | $ 201,759 | $ 248,419 |
| Interest | 64,244 | 68,236 | 78,034 | 61,112 | 39,680 | 63,761 | 63,691 | 51,675 |
| Demographic experience | (116,016) | (23,886) | 35,142 | (506,672) | 136,185 | (30,559) | (311,536) | - |
| Assumption changes | 574,445 | (85,640) | (469,559) | (541,844) | 345,945 | (260,426) | 155,090 | - |
| Benefit payments | (52,084) | (53,525) | (38,070) | (30,584) | (53,126) | (51,263) | (57,314) | (35,371) |
| Net change in total OPEB liability | 757,382 | 61,073 | (251,832) | (837,191) | 821,361 | (100,117) | 51,690 | 264,723 |
| Total OPEB liability - beginning | 1,321,371 | 1,260,298 | 1,512,130 | 2,349,321 | 1,527,960 | 1,628,077 | 1,576,387 | 1,311,664 |
| Total OPEB liability - ending | $ 2,078,753 | $1,321,371 | $1,260,298 | $1,512,130 | $2,349,321 | $1,527,960 | $1,628,077 | $1,576,387 |
| Covered employee payroll | 16,988,715 | 13,868,882 | 12,457,811 | 11,037,937 | 13,069,476 | 11,304,940 | 11,120,726 | 10,025,200 |
| Total OPEB liability as a percentage of covered employee payroll | 12.24% | 9.53% | 10.12% | 13.70% | 17.98% | 13.52% | 14.64% | 15.72% |
*Data reported for fiscal years above is based on the Authority's Healthcare Plan's measurement dates of September 30. Changes in the total OPEB liability for the fiscal years prior to 2018 were not available and accordingly, not included in the schedule. There are no assets accumulated in a trust to pay related benefits for the OPEB plan.
CANAVERAL PORT AUTHORITY
Statistical Section Narrative
UNAUDITED
A. FINANCIAL TRENDS PAGE 38-47
These schedules contain trend information to help the reader understand how the Authority’s financial performance and well-being has changed over time. The Authority engages in business-type activities and presents revenues by major source and distinguishes between operating and non-operating revenues and expenses.
B. REVENUE CAPACITY PAGE 48-53
These schedules contain information to help the reader assess the Authority’s most significant revenue sources: cargo and cruise revenue.
C. DEBT CAPACITY PAGE 54-56
D. DEMOGRAPHIC AND ECONOMIC INFORMATION PAGE 57-59
E. OPERATING INFORMATION PAGE 60-65
These schedules contain information about the Authority’s operations and resources to help the reader understand how the Authority’s financial information relates to the services it provides and the activities it performs.
Source: Unless otherwise noted, the information in these schedules is derived from the annual financial reports for the relevant year.
Canaveral Port Authority
Fiscal Years ended September 30, 2016 through 2025
| Fiscal Year | Net Investment in Capital Assets | Restricted for Debt Service | Unrestricted | Total | |
|---|---|---|---|---|---|
| 2016 | $ 305,846 | $ 1,825 | $ - | $ 28,982 | $ 336,653 |
| 2017 * | 285,685 | 5,235 | - | 53,401 | 344,321 |
| 2018 | 287,311 | 5,235 | - | 65,568 | 358,114 |
| 2019 ** | 305,092 | 12,152 | - | 65,134 | 382,378 |
| 2020 | 290,424 | 12,361 | - | 63,538 | 366,323 |
| 2021 | 250,807 | 12,623 | - | 54,562 | 317,992 |
| 2022 | 273,281 | 12,771 | - | 117,049 | 403,101 |
| 2023 *** | 289,432 | 12,931 | 5,000 | 217,889 | 525,252 |
| 2024 *** | 365,479 | 13,104 | 10,000 | 222,010 | 610,593 |
| 2025 | 415,961 | 13,293 | 15,000 | 250,071 | 694,325 |
Canaveral Port Authority
Operating Revenues by Source
Fiscal Years ended September 30, 2016 through 2025
| Fiscal Year | Dockage | Wharfage | Leases | Water | Parking | Line- handling | Recreation | Fire Training Facility | Commercial Vehicle | Miscellaneous | Total |
|---|---|---|---|---|---|---|---|---|---|---|---|
| 2016 | 7,106,444 | 50,601,459 | 5,588,459 | 1,365,761 | 14,967,052 | 1,048,527 | 3,119,327 | ** 110,403 | 633,874 | 936,907 | 85,478,213 |
| 2017 | 7,837,207 | 54,173,635 | * 6,914,194 | 1,459,841 | 16,739,081 | 1,160,118 | 2,686,091 | ** 112,847 | 1,104,587 | 1,091,918 | * 93,279,519 |
| 2018 | 8,992,071 | 57,033,065 | * 8,414,872 | 1,230,951 | 19,211,928 | 1,407,933 | 3,178,419 | ** 126,703 | 1,460,186 | 652,577 | * 101,708,705 |
| 2019 | 8,695,601 | 60,457,528 | 9,252,306 | 1,175,649 | 19,604,009 | 1,254,120 | 3,314,067 | ** 207,812 | 1,584,389 | 965,951 | 106,511,432 |
| 2020 | 9,072,939 | 33,277,045 | 9,699,530 | 905,464 | 9,405,128 | 1,067,417 | 2,033,680 | ** 114,158 | 908,927 | 619,882 | 67,104,170 |
| 2021 | 8,279,495 | 9,855,931 | 9,258,649 | 412,511 | 1,876,428 | 903,220 | 3,181,606 | ** 182,801 | 40,701 | 557,952 | 34,549,294 |
| 2022 | 16,332,621 | 67,914,886 | 9,916,482 | 713,535 | 26,150,224 | 1,856,065 | 4,056,137 | ** 247,179 | 1,162,170 | 606,175 | 128,955,474 |
| 2023 | 18,194,138 | 111,442,773 | 10,883,416 | 707,692 | 41,302,548 | 2,219,386 | 3,941,774 | ** 360,749 | 1,877,940 | 869,239 | 191,799,655 |
| 2024 | 17,207,389 | 108,222,551 | 11,929,083 | 446,689 | 44,954,699 | 2,236,666 | 3,970,409 | 316,930 | 1,935,659 | 631,480 | 191,851,555 |
| 2025 | 19,660,057 | 124,525,483 | 10,647,896 | 844,168 | 52,732,448 | 2,496,630 | 4,026,068 | 416,708 | 1,951,963 | 628,399 | 217,929,820 |
Canaveral Port Authority
Operating Revenues by Activity
Fiscal Years ended September 30, 2016 through 2025
| Fiscal Year | Cruise | Cargo | Recreation | Leases | Ground Trans- portation | Other | Total |
|---|---|---|---|---|---|---|---|
| 2016 | 68,214,524 | 6,870,898 | 2,625,225 | 5,588,459 | 633,874 | 1,545,233 | 85,478,213 |
| 2017 | 72,799,989 | 8,569,893 | 2,686,091 | 6,914,194 | 1,104,587 | 1,204,765 | 93,279,519 |
| 2018 | 77,734,133 | 10,141,812 | 3,178,419 | 8,414,872 | 1,460,186 | 779,283 | 101,708,705 |
| 2019 | 81,914,307 | 9,272,598 | 3,314,067 | 9,252,306 | 1,584,389 | 1,173,765 | 106,511,432 |
| 2020 | 44,097,826 | 9,629,868 | 2,032,900 | 9,699,530 | 908,927 | 735,119 | 67,104,170 |
| 2021 | 10,184,479 | 11,143,105 | 3,181,606 | 9,258,649 | 40,701 | 740,754 | 34,549,294 |
| 2022 | 99,014,902 | 18,488,881 | 4,056,137 | 5,380,030 * | 1,162,170 | 853,354 | 128,955,474 |
| 2023 | 158,015,193 | 20,538,883 | 3,941,774 | 6,195,877 | 1,877,940 | 1,229,988 | 191,799,655 |
| 2024 | 156,032,210 | 23,216,396 | 3,963,299 | 5,748,471 | 1,935,659 | 955,520 | 191,851,555 |
| 2025 | 181,884,695 | 24,541,740 | 4,026,068 | 4,480,248 | 1,951,963 | 1,045,106 | 217,929,820 |
Schedule A-4
Canaveral Port Authority
Non-Operating Revenues
Fiscal Years ended September 30, 2016 through 2025
| Fiscal Year | Interest Earnings | Grant Revenue | Other | Total |
|---|---|---|---|---|
| 2016 | 164,880 | 156,592 | 829,866 | 1,151,338 |
| 2017 | 445,598 | 288,411 | 3,998,937 * | 4,732,946 |
| 2018 | 809,438 | 765,757 | 723,946 | 2,299,141 |
| 2019 | 3,412,808 | 567,455 | 704,596 | 4,684,859 |
| 2020 | 1,600,821 | 460,826 | 7,356 | 2,069,003 |
| 2021 | 217,578 | 15,440,776 | 2,953,254 ** | 18,611,608 |
| 2022 | (804,109) | 43,411,126 | 1,495,476 | 44,102,493 |
| 2023 | 7,063,893 | 15,006,995 | 147,102 | 22,217,990 |
| 2024 | 11,332,065 | 1,010,505 | 71,200 | 12,413,770 |
| 2025 | 11,402,252 | 903,589 | 152,804 | 12,458,645 |
** Included in this amount is a gain on sale of an asset for $2.4M.
Canaveral Port Authority
Total Revenue by Activity - FY2025
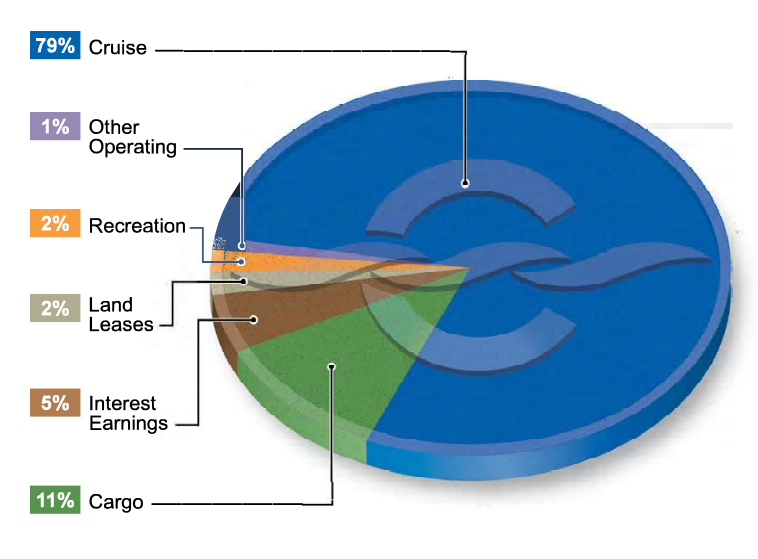
$230,388,465
Canaveral Port Authority
Operating Expenses (in thousands)
Fiscal Years ended September 30, 2016 through 2025
| Fiscal Year | Operations | Facilities | Public Safety | Recreation | Fire Training | Commission | Executive | Finance & Accounting | Admini- strative Services | Engineering, & Environ- mental | Business Develop- ment | Real Estate | Government & Strategic Comm- unications | Depreciation | Amortization | Total |
|---|---|---|---|---|---|---|---|---|---|---|---|---|---|---|---|---|
| 2016 | 6,651 | 8,906 | 7,867 | 2,265 ** | 180 | 458 | 1,747 * | 1,556 | 4,446 | 1,936 | 1,520 | 1,112 | 855 | 34,555 | 1,275 | 75,329 |
| 2017 | 6,944 | 10,604 | 8,676 | 2,089 ** | 190 | 327 | 1,522 * | 1,655 | 5,854 | 5,633 | 1,174 | 630 | 1,118 | 38,515 | 365 | 85,296 |
| 2018 | 6,443 | 11,351 | 9,156 | 2,205 ** | 202 | 305 | 1,542 | 1,825 | 6,046 | 2,739 | 1,606 | 893 | 1,018 | 43,140 | 482 | 88,953 |
| 2019 | 9,217 | 10,773 | 9,701 | 2,221 ** | 299 | 332 | 1,829 | 1,717 | 6,501 | 2,556 | 1,714 | 798 | 1,179 | 38,554 | 531 | 87,922 |
| 2020 | 6,966 | 10,028 | 10,103 | 1,858 ** | 235 | 293 | 1,741 | 1,706 | 8,079 | 2,359 | 1,525 | 510 | 1,181 | 38,957 | 578 | 86,119 |
| 2021 | 2,958 | 8,278 | 9,078 | 1,659 ** | 238 | 266 | 1,714 | 1,643 | 7,446 | 1,712 | 736 | 492 | 939 | 49,078 | 611 | 86,848 |
| 2022 | 8,938 | 11,602 | 10,349 | 2,201 ** | 295 | 303 | 1,854 | 1,901 | 8,123 | 1,885 | 773 | 330 | 1,103 | 48,790 | 457 | 98,904 |
| 2023 | 13,278 | 14,254 | 11,414 | 2,167 ** | 385 | 339 | 2,184 | 2,032 | 9,846 | 2,315 | 990 | 380 | 1,396 | 47,387 | 468 | 108,835 |
| 2024*** | 16,824 | 17,084 | 13,113 | 2,153 | 379 | 329 | 3,234 | 2,265 | 11,266 | 2,472 | 1,114 | 398 | 1,492 | 46,587 | 1,250 | 119,960 |
| 2025 | 17,741 | 26,201 | 14,426 | 2,498 | 438 | 355 | 3,393 | 2,496 | 11,929 | 2,972 | 1,120 | 526 | 1,817 | 48,372 | 1,221 | 135,505 |
Canaveral Port Authority
Non-Operating Expenses
Fiscal Years ended September 30, 2016 through 2025
| Fiscal Year | Interest & Amortization | Commissions & Fees | Loss on Capital Asset Disposals | Other | Total |
|---|---|---|---|---|---|
| 2016 | 7,202,480 | 295,368 | 626,509 | 40,000 | 8,164,357 |
| 2017 | 8,900,648 | 923,113 * | 78,981 | - * | 9,902,742 |
| 2018 | 9,527,142 | 104,312 | 931,634 | 533,770 | 11,096,858 |
| 2019 | 13,222,111 | 827,550 | 5,026 | 195,201 | 14,249,888 |
| 2020 | 9,932,652 | 424,935 | 505,000 | 142,320 | 11,004,907 |
| 2021 | 12,516,878 | 183,030 | 1,658,837 | 572,079 | 14,930,824 |
| 2022 | 12,139,624 | 148,622 | - | 259,620 | 12,547,866 |
| 2023 | 12,282,093 | 95,093 | 100,683 | 995,650 | 13,473,519 |
| 2024 | 12,152,951 | 97,186 | 1,219,785 | 137,881 | 13,607,803 |
| 2025 | 11,432,594 | 39,118 | 1,490,639 | 480,355 | 13,442,706 |
Canaveral Port Authority
Changes in Net Position
Fiscal Years ended September 30, 2016 through 2025
| Fiscal Year | Net Operating Income/(Loss) | Net Non-Operating Revenue or (Expense) | Income/(Loss) before Contributions & Special Items | Capital Contributions | Change in Net Position |
|---|---|---|---|---|---|
| 2016 | 10,149,451 | (7,013,019) | 3,136,432 | 6,634,056 | 9,770,488 |
| 2017 | 7,983,034 | (5,169,796) | 2,813,238 | 4,854,580 | 7,667,818 |
| 2018 | 12,755,824 | (8,797,717) | 3,958,107 | 9,834,725 | 13,792,832 |
| 2019 | 18,589,628 | (9,565,029) | 9,024,599 | 15,239,301 | 24,263,900 |
| 2020 | (19,014,956) | (8,935,904) | (27,950,860) | 11,896,455 | (16,054,405) |
| 2021 | (52,299,044) | 3,680,784 | (48,618,260) | 287,128 | (48,331,132) |
| 2022 | 30,051,426 | 31,554,627 | 61,606,053 | 23,502,430 | 85,108,483 |
| 2023 | 82,964,529 | 8,744,471 | 91,709,000 | 30,442,555 | 122,151,555 |
| 2024 * | 71,888,823 | (1,194,033) | 70,694,790 | 14,646,267 | 85,341,057 |
| 2025 | 82,424,960 | (984,061) | 81,440,899 | 2,290,263 | 83,731,162 |
Schedule A-9
Canaveral Port Authority
Total Expenses - FY2025
.png?sfvrsn=49a1351_1)
$148,947,566
Schedule A-10
Canaveral Port Authority
Operating Revenues & Expenses FY 2005 - FY 2025
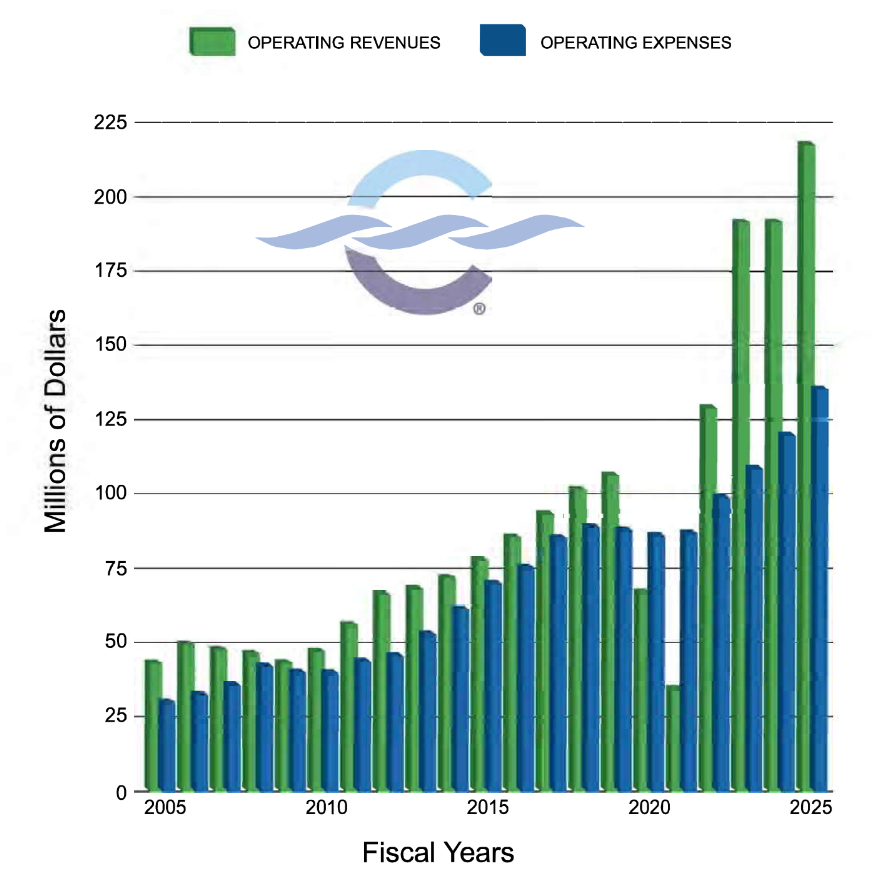
Canaveral Port Authority
Cargo Revenue
Fiscal Years ended September 30, 2016 through 2025
| Commodity | 2016 | 2017 | 2018 | 2019 | 2020 | 2021 | 2022 | 2023 | 2024 | 2025 |
|---|---|---|---|---|---|---|---|---|---|---|
| Petroleum | $ 3,261,288 | $ 3,460,935 | $ 3,714,869 | $ 3,704,278 | $ 3,016,994 | $ 2,837,170 | $ 3,935,588 | $ 5,606,188 | $ 5,675,570 | $ 5,246,209 |
| Cement** | 198,832 | 246,483 | 297,470 | 203,589 | 252,114 | 254,200 | 255,359 | 357,632 | 652,166 | 707,532 |
| Newsprint | 123,857 | 262,757 | 404,978 | 321,709 | 223,223 | - | - | - | - | - |
| Scrap Metal | 5,930 | 477 | 15,516 | 51,374 | 58 | 56 | 7,116 | 58,677 | - | - |
| Salt | 371,229 | 505,788 | 496,951 | 527,901 | 533,132 | 472,147 | 569,650 | 691,496 | 684,350 | 781,958 |
| Forest Products | 131,123 | 367,015 | 735,440 | 866,934 | 1,157,605 | 2,151,277 | 2,984,413 | 5,777,278 | 6,389,278 | 6,870,997 |
| Concentrates | 102,878 | 39,275 | 31,186 | 33,970 | 23,732 | 101,287 | 91,157 | 27,806 | 25,896 | 17,111 |
| Single Strength Juice | 33,493 | 21,049 | - | - | - | - | - | - | - | - |
| General Misc. * | 558,141 | 906,420 | 1,215,792 | 492,951 | 1,002,114 | 1,449,253 | 1,689,650 | 2,137,091 | 2,128,723 | 2,066,476 |
| Containers | 206,941 | 540,687 | 406,577 | 136,622 | 111,996 | 133,932 | 83,730 | 200,189 | 37,460 | 75,324 |
| Automobiles/Trucks/Boats | 182,081 | 299,827 | 594,905 | 390,149 | 255,428 | 1,483 | 1,093 | 1,832 | 6,595 | 37,826 |
| Bulk Fertilizer | 164,544 | 102,870 | 100,869 | 153,990 | 114,128 | 247,647 | 238,231 | 971,152 | 253,853 | 165,098 |
| Limestone/Aggregate | 374,178 | 400,754 | 584,434 | 656,620 | 615,073 | 807,842 | 777,690 | 851,457 | 731,734 | 567,894 |
| Granite/Rock | 455,887 | 509,905 | 668,142 | 609,056 | 644,231 | 463,717 | 962,308 | 786,189 | 1,028,799 | 1,008,862 |
| Slag/Sand | 700,496 | 885,651 | 702,258 | 847,279 | 611,417 | 904,139 | 1,019,942 | 1,338,495 | 1,250,797 | 1,332,238 |
| Space/Rocket Boosters | - | - | 172,425 | 276,176 | 1,068,623 | 1,318,965 | 1,356,502 | 1,733,401 | 2,961,009 | 4,254,078 |
| Gaming | - | - | - | - | - | - | - | - | 1,390,166 | 1,421,930 |
| Totals | $ 6,870,898 | $ 8,569,893 | $ 10,141,812 | $ 9,272,598 | $ 9,629,868 | $ 11,143,105 | $ 13,952,429 | $ 20,538,883 | $ 23,216,396 | $ 24,553,533 |
* Includes minimum annual guarantees and layberth dockage.
** FY2014-2016 Revenue is from a contract with required shortage minimum guarantee.
.png?sfvrsn=1836030a_1)
Schedule B-3
Canaveral Port Authority
Cargo Revenue - FY 2025
.png?sfvrsn=5402858_1)
$24,553,533
Canaveral Port Authority
Revenue Passengers
Fiscal Years ended September 30, 2016 through 2025
| Fiscal Year | Multi Day Cruises |
|---|---|
| 2016 | 3,951,127 |
| 2017 | 4,240,942 |
| 2018 | 4,568,431 |
| 2019 | 4,634,154 |
| 2020 | 2,261,431 |
| 2021 | 233,216 |
| 2022 | 4,071,893 |
| 2023 | 6,780,927 |
| 2024 | 7,592,535 |
| 2025 | 8,602,047 |
Schedule B-5
.png?sfvrsn=2b751e4f_1)
Schedule B-6
Canaveral Port Authority
Ten Largest Revenue Generating Customers
Fiscal Years ended September 30, 2025 and 2016
| FY 2025 Customer | FY 2025 Revenue | Rank | Percentage of Total Revenue |
|---|---|---|---|
| Carnival Cruise Line/Seabourn | $ 66,445,599 * | 1 | 28.8% |
| Royal Caribbean Group | 55,661,238 * | 2 | 24.2% |
| Magical Cruise Company dba DCL Port Facilities, LLC | 33,513,029 * | 3 | 14.5% |
| MSC Cruises | 18,866,324 * | 4 | 8.2% |
| Norwegian Cruise Line | 6,892,695 * | 5 | 3.0% |
| Ambassador Services International | 5,470,441 | 6 | 2.4% |
| Seaport Canaveral Corp. (Vitol & Sunoco) | 2,964,088 | 7 | 1.3% |
| SpaceX | 2,750,790 | 8 | 1.2% |
| Blue Origin Enterprises | 1,942,230 | 9 | 0.8% |
| Norton Lilly | 1,743,567 | 10 | 0.8% |
| Totals | $ 196,250,001 | 85.2% |
| FY 2016 Customer | FY 2016 Revenue | Rank | Percentage of Total Revenue |
|---|---|---|---|
| Carnival Cruise Line | $ 21,728,502 * | 1 | 25.1% |
| Magical Cruise Lines | 21,291,875 * | 2 | 24.6% |
| MLSBC Cruise Ltd. | 19,659,684 * | 3 | 22.7% |
| Norwegian Cruise Line | 2,764,674 * | 4 | 3.2% |
| Victory Casino Cruise | 2,304,531 | 5 | 2.7% |
| Seaport Canaveral | 1,973,493 | 6 | 2.3% |
| Ambassador Services, Inc & LLC | 1,933,688 | 7 | 2.1% |
| Moran Gulf Shipping | 715,779 | 8 | 0.8% |
| Martin Marietta | 656,536 | 9 | 0.8% |
| TransMontagne Terminals LLC | 556,085 | 10 | 0.6% |
| Totals | $ 73,584,847 | 84.9% |
This report is generated by the Finance Department.
Schedule C-1
Canaveral Port Authority
Revenue Bond Coverage
Fiscal Years ended September 30, 2016 through 2025
| Fiscal Year | Gross Revenue (1) | Total Expenses (2) | Net Revenue Available for Debt Service |
|---|---|---|---|
| 2016 | 85,643,093 | 39,794,234 | 45,848,859 |
| 2017 | 93,725,117 | 47,294,188 | 46,430,929 |
| 2018 | 102,518,143 | 45,872,338 | 56,645,805 |
| 2019 | 109,924,240 | 49,803,710 | 60,120,530 |
| 2020 | 68,704,991 | 47,093,326 | 21,611,665 |
| 2021 | 50,078,252 | 37,852,091 | 12,226,160 |
| 2022 | 171,386,266 | 49,946,995 | 121,439,271 |
| 2023 | 212,522,343 | 62,012,296 | 150,510,047 |
| 2024 | 203,184,773 | 71,409,170 | 131,775,603 |
| 2025 | 229,332,072 | 86,431,322 | 142,900,750 |
| Fiscal Year | Debt Service Requirements | Coverage (3) | ||
|---|---|---|---|---|
| Principal | Interest | Total | ||
| 2016 | 13,064,689 | 6,350,480 | 19,415,169 | 2.36 |
| 2017 | 12,538,605 | 8,442,510 | 20,981,115 | 2.21 |
| 2018 | 11,684,412 | 9,363,621 | 21,048,033 | 2.69 |
| 2019 | 12,052,895 | 9,542,919 * | 21,595,815 | 2.78 |
| 2020 | 1,501,000 ** | 7,184,498 ** | 8,685,498 | 2.49 |
| 2021 | - ** | 625,976 ** | 625,976 | 19.53 |
| 2022 | 15,904,062 | 11,938,581 | 27,842,644 | 4.36 |
| 2023 | 16,545,000 | 11,589,650 | 28,134,650 | 5.35 |
| 2024 | 16,910,000 | 11,232,814 | 28,142,814 | 4.68 |
| 2025 | 17,296,000 | 10,844,638 | 28,140,638 | 5.08 |
(2) Expenses do not include non-cash outlays such as depreciation, amortization, bad debt expense, loss on equipment disposals, interest or any grant related expenses.
(3) Required coverage is 1.25
* Amount does not include bond proceeds used for debt service
** Amount does not include defeased debt.
Canaveral Port Authority
Ratios of Outstanding Debt By Type
Fiscal Years ended September 30, 2016 through 2026
| Fiscal Year | Revenue & Direct Borrowing Bonds* | Line of Credit | Notes Payable | Total Debt | Ratio of Debt to Ship Revenue (1) | Total Debt Per Passenger (2) |
|---|---|---|---|---|---|---|
| 2016 | $ 246,426,583 | $ 31,023,249 | $ 108,027 | $ 277,557,859 | 370% | $ 65 |
| 2017 | 289,432,977 | 15,985,543 | - | 305,418,520 | 375% | 67 |
| 2018 | 277,748,566 | 15,985,543 | - | 293,734,109 | 334% | 61 |
| 2019 | 383,662,581 | 45,772,035 | - | 429,434,616 | 471% | 88 |
| 2020 | 405,929,990 | 45,772,035 | - | 451,702,025 | 841% | 189 |
| 2021 | 390,531,007 | 37,646,680 | - | 428,177,687 | 2008% | 1,161 |
| 2022 | 374,383,962 | 24,000,000 | - | 398,383,962 | 339% | 95 |
| 2023 | 357,595,980 | 21,000,000 | - | 378,595,980 | 212% | 56 |
| 2024 | 340,442,997 | 21,000,000 | - | 361,442,997 | 202% | 48 |
| 2025 | 322,904,014 | 21,000,000 | - | 343,904,014 | 167% | 40 |
(2) To find Total Debt per Passenger Schedule B-4 was used.
* Revenue bonds payable net of unamortized discounts and premiums.
Canaveral Port Authority
Demographic Statistics for Brevard County
(Estimates)
Fiscal Years ended September 30, 2015 through 2024
| Fiscal Year | Population (1) | Personal Income (in thousands) (2) | Per Capita Personal Income (2) | Unemployment Rate (1) |
|---|---|---|---|---|
| 2016 | 568,088 | 24,258,583 | 42,015 | 5.2 |
| 2017 | 579,130 | 25,823,177 | 43,905 | 3.6 |
| 2018 | 583,563 | 27,455,164 | 46,145 | 3.0 |
| 2019 | 594,469 | 29,172,881 | 48,539 | 3.0 |
| 2020 | 606,612 | 31,339,828 | 51,507 | 5.2 |
| 2021 | 616,742 | 34,209,428 | 55,477 | 3.8 |
| 2022 | 627,544 | 35,833,890 | 56,817 | 2.5 |
| 2023 | 640,773 | 38,742,746 | 60,162 | 3.2 |
| 2024 | 653,703 | 42,250,307 | 64,167 | 3.3 |
| 2025 | 667,900 | (3) | (3) | 4.6 |
(2) U.S. Bureau of Economic Analysis
(3) Information not available for this year.
Schedule D2
Canaveral Port Authority
Principal Employers
Brevard County 2025 and 2016
| Employer | 2025 | 2016 | ||||
|---|---|---|---|---|---|---|
| Number of Employees | Percentage of Total | Rank | Number of Employees | Percentage of Total | Rank | |
| Brevard County School Board | 9,600 | 3.31% | 1 | 8,560 | 3.50% | 1 |
| Health First Medical Group, LLC | 9,500 | 3.28% | 2 | 7,790 | 3.18% | 2 |
| L3Harris Technologies, Inc. | 7,600 | 2.62% | 3 | 5,845 | 2.39% | 3 |
| Northrop Grumman Corporation | 5,000 | 1.72% | 4 | 1,915 | 0.78% | 7 |
| Wal-Mart Associates, Inc. | 4,200 | 1.45% | 5 | - | - | - |
| Publix Super Markets, Inc. | 4,000 | 1.38% | 6 | - | - | - |
| Brevard County Board of County Commissioners | 2,500 | 0.86% | 7 | 2,360 | 0.96% | 4 |
| National Aeronautics Space Administration | 2,300 | 0.79% | 8 | 2,005 | 0.81% | 6 |
| Lockheed Martin Corp | 1,600 | 0.55% | 9 | - | - | - |
| Teletech Services Corp | 1,500 | 0.52% | 10 | - | - | - |
| U.S Department of Defense | - | - | - | 2,285 | 0.93% | 5 |
| Wuesthoff Health Systems | - | - | - | 1,785 | 0.73% | 8 |
| Brevard County Sheriff’s Office | - | - | - | 1,280 | 0.52% | 10 |
| Rockwell Collins, Inc | - | - | - | 1,610 | 0.66% | 9 |
| Total | 47,800 | 16.48% | 35,435 | 14.47% | ||
| Total County Employment | 290,000 | 244,751 | ||||
Schedule D-3
Canaveral Port Authority
Approved Commissioner Districts and Registered Voters, September 2025
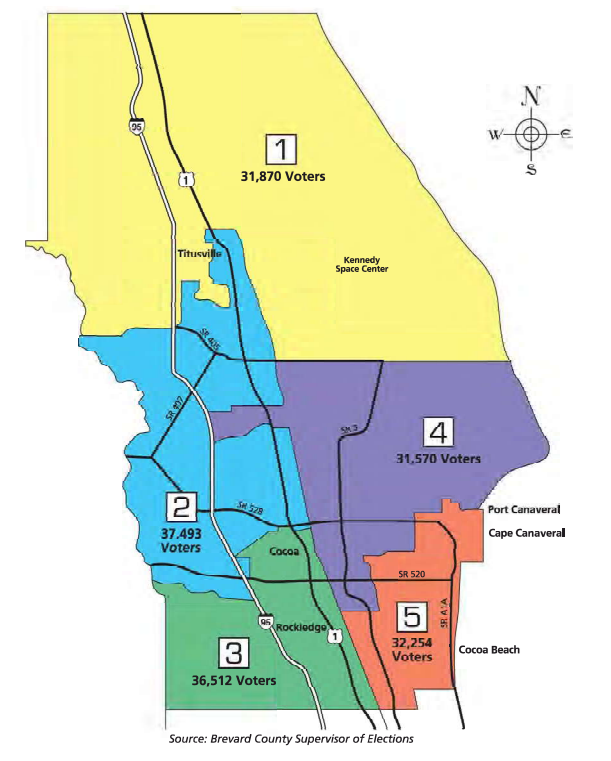
Schedule E1
Canaveral Port Authority
Employee Positions by Function - Full Time Equivalent
Fiscal Years ended September 30, 2016 through 2025
| Fiscal Year | Administration | Operations & Facilities | Recreation | Public Safety | Total |
|---|---|---|---|---|---|
| 2016 | 55.0 | 125.0 | 26.0 | 5.0 | 211.0 |
| 2017 | 53.0 | 140.5 | 25.0 | 5.0 | 223.5 |
| 2018 | 67.0 | 133.0 | 27.5 | 6.0 | 233.5 |
| 2019 | 73.0 | 136.5 | 27.0 | 6.0 | 242.5 |
| 2020 | 63.0 | 72.0 | 15.5 | 4.0 | 154.5 |
| 2021 | 59.6 | 103.6 | 17.6 | 4.0 | 184.8 |
| 2022 | 62.5 | 112.5 | 17.5 | 5.0 | 197.5 |
| 2023 | 69.0 | 155.5 | 16.5 | 5.0 | 246.0 |
| 2024 | 70.0 | 174.0 | 19.0 | 5.0 | 268.0 |
| 2025 | 77.0 | 194.0 | 19.0 | 6.0 | 296.0 |
* Balances have been reclassified to remove Parks and Recreation, & Exploration Tower.
IMPORTS
| COUNTRY | COMMODITY |
|---|---|
| Argentina | Petroleum, Juice Concentrate |
| Ascension Island | Containers, Machinery/Equipment |
| The Bahamas | Containers, General, Petroleum, Limestone, Machinery/Equipment, Roll-on/Roll-off, Salt |
| Canada | Granite, Aggregate, Petroleum |
| Chile | Fertilizer |
| China | Petroleum, General, Steel & Iron |
| Colombia | Petroleum |
| Egypt | Supersacks |
| Germany | Lumber, Containers, General |
| India | Petroleum, General |
| Japan | Slag |
| Latvia | Hardwood Plywood, Lumber |
| Mexico | Petroleum |
| Poland | Hardwood Plywood |
| The Netherlands | Petroleum |
| Netherlands Antilles | Petroleum |
| Nigeria | Petroleum |
| Norway | Fertilizer, Supersacks |
| Puerto Rico | Roll-on/Roll-off |
| Romania | Hardwood Plywood |
| Saudi Arabia | Petroleum |
| South Korea | Petroleum |
| Spain | Aggregate, Roll-on/Roll-off, Steel & Iron |
| Sweden | Petroleum, Lumber, Wood Pulp |
| Turkey | Supersacks, General |
| U.S.A. | Petroleum, Space Components, General, Machinery/Equipment |
EXPORTS
| COUNTRY | COMMODITY |
|---|---|
| Ascension Island | Containers, Machinery/Equipment Roll-on/Roll-off |
| The Bahamas | Machinery/Equipment |
| Dominican Republic | Petroleum, Dry Bulk NOS |
| France | Containers, Machinery/Equipment |
| Jamaica | Petroleum |
| Puerto Rico | Lumber, Steel & Iron, General, Hardboard Plywood |
| U.S.A. | Petroleum, Space Components, General, Machinery/Equipment |
Cargo Tonnage
(in short tons)
Fiscal Years ended September 30, 2016 through 2025
| Commodity | 2016 | 2017 | 2018 | 2019 | 2020 | 2021 | 2022 | 2023 | 2024 | 2025 |
|---|---|---|---|---|---|---|---|---|---|---|
| Petroleum | 3,845,853 | 3,957,363 | 3,982,524 | 3,850,344 | 2,572,886 | 2,458,378 | 3,333,197 | 3,711,106 | 3,599,879 | 3,176,735 |
| Cement | - | - | 5,650 | - | - | - | - | - | 64,775 | 70,136 |
| Newsprint | 21,428 | 46,692 | 78,587 | 62,258 | 41,916 | - | - | - | - | - |
| Salt | 220,329 | 277,976 | 332,180 | 362,922 | 343,290 | 291,307 | 223,915 | 253,589 | 196,526 | 228,707 |
| Forest products | 29,410 | 111,185 | 211,911 | 277,674 | 350,383 | 643,951 | 930,012 | 997,792 | 731,886 | 888,688 |
| Concentrate | 25,125 | 10,510 | 6,006 | 6,594 | 5,193 | 13,566 | 13,804 | 5,643 | 5,646 | 3,183 |
| Single Strength Juice | 11,447 | 4,893 | - | - | - | - | - | - | - | - |
| General Miscellaneous | 20,259 | 57,585 | 66,541 | 15,871 | 33,424 | 63,518 | 89,393 | 133,718 | 39,215 | 9,904 |
| Containers | - | 41,943 | 66,902 | 7,084 | 7,054 | 11,002 | 7,929 | 10,314 | 2,327 | 2,984 |
| Automobiles/Trucks/Boats | 12,244 | 39,835 | 40,523 | 23,721 | 11,576 | 317 | 184 | 1,740 | 879 | 509 |
| Bulk Fertilizer | 81,411 | 43,552 | 41,834 | 59,174 | 38,308 | 78,051 | 68,272 | 65,026 | 69,282 | 51,793 |
| Limestone/Aggregate | 315,564 | 344,751 | 478,587 | 510,337 | 463,822 | 619,011 | 544,040 | 577,495 | 459,660 | 296,071 |
| Granite/Rock | 318,261 | 404,229 | 496,774 | 442,880 | 459,841 | 352,150 | 613,575 | 552,868 | 650,618 | 653,953 |
| Slag/Sand | 595,697 | 650,249 | 609,107 | 710,236 | 450,676 | 671,283 | 740,558 | 791,420 | 730,928 | 740,632 |
| Totals | 5,497,028 | 5,990,763 | 6,417,126 | 6,329,095 | 4,778,369 | 5,202,534 | 6,564,879 | 7,100,711 | 6,551,621 | 6,123,295 |
Canaveral Port Authority
Operating Indicators by Function
Fiscal Years ended September 30, 2016 through 2025
| 2016 | 2017 | 2018 | 2019 | 2020 | 2021 | 2022 | 2023 | 2024 | 2025 | |
|---|---|---|---|---|---|---|---|---|---|---|
| Cruise | ||||||||||
| Multi Day Cruises | 668 | 658 | 693 | 686 | 459 | 173 | 792 | 906 | 911 | 1,038 |
| Public Safety | ||||||||||
| Fire Calls | 262 | 296 | 254 | 210 | 213 | 191 | 181 | 26 | 36 | 45 |
| Calls | 2,512 | 2,541 | 2,825 | 2,679 | 2,523 | 2,232 | 3,222 | 3,059 | 3,490 | 3,447 |
Schedule E5
Canaveral Port Authority
Capital Assets by Function
Fiscal Years ended September 30, 2016 through 2025
| 2016 | 2017 | 2018 | 2019 | 2020 | 2021 | 2022 | 2023 | 2024 | 2025 | |
|---|---|---|---|---|---|---|---|---|---|---|
| General | ||||||||||
| Cruise Terminals | 7 | 7 | 7 | 7 | 7 | 7 | 7 | 7 | 7 | 7 |
| Cargo Terminals | 11 | 11 | 11 | 11 | 11 | 11 | 11 | 11 | 11 | 11 |
| Warehouse Storage sq ft (in thousands) | 567 | 567 | 567 | 567 | 567 | 317 | 317 | 317 | 317 | 317 |
| Developed Land | 715 | 715 | 725 | 725 | 725 | 725 | 725 | 725 | 725 | 725 |
| Public Boat Docks | 10 | 10 | 10 | 10 | 10 | 10 | 10 | 10 | 10 | 10 |
| Public Safety | ||||||||||
| Security Building | 1 | 0 | 0 | 0 | 0 | 0 | 0 | 0 | 0 | 0 |
| Interagency Maritime Operations Center | 1 | 1 | 1 | 1 | 1 | 1 | 1 | 1 | 1 | 1 |
| Fire Boats | 1 | 1 | 1 | 1 | 1 | 2 | 2 | 2 | 2 | 2 |
| Mobile Command Center | 1 | 1 | 1 | 1 | 1 | 1 | 1 | 1 | 1 | 1 |
| Fire Station | 2 | 2 | 2 | 2 | 2 | 2 | 2 | 2 | 2 | 2 |
| Fire/Rescue Vehicles | 6 | 6 | 6 | 6 | 6 | 6 | 6 | 6 | 6 | 8 |
Public safety section is supplied by the Public Safety Department and Fire Department.
Canaveral Port Authority
Capital Improvements
Fiscal Years ended September 30, 2016 through 2025
| Fiscal Year | Total |
|---|---|
| 2016 | $ 112,777,097 |
| 2017 | 31,716,607 |
| 2018 | 37,850,476 |
| 2019 | 115,013,154 |
| 2020 | 107,138,941 |
| 2021 | 15,227,088 * |
| 2022 | 42,649,542 |
| 2023 | 55,086,210 |
| 2024 | 115,687,007 |
| 2025 | 80,132,942 |
Schedule of Comparative Revenues, Expenses and Changes
in Net Position, Years Ended September 30, 2025, 2024, 2023,
2022, and 2021
Schedule of Comparative Revenues, Expenses and Changes in Net Position - Unaudited
Fiscal Years Ended September 30,
| 2025 | 2024* | 2023 | 2022 | 2021 | |
|---|---|---|---|---|---|
| Operating revenues | |||||
| Dockage | $ 19,660,057 | $ 17,207,389 | $ 18,194,138 | $ 16,332,621 | $ 8,279,495 |
| Wharfage | 123,367,918 | 107,422,256 | 110,861,378 | 67,372,871 | 9,215,706 |
| Water | 844,168 | 446,689 | 707,692 | 713,535 | 412,511 |
| Parking | 52,732,448 | 44,954,699 | 41,302,548 | 26,150,224 | 1,878,428 |
| Line handling | 2,496,630 | 2,236,665 | 2,219,386 | 1,856,065 | 903,220 |
| Terminal/crane/RORO | 1,157,565 | 800,295 | 581,395 | 542,015 | 640,225 |
| Leases | 4,480,248 | 5,748,471 | 6,195,877 | 5,380,030 | 9,258,649 |
| Leases-Cargo | 6,167,648 | 6,180,612 | 4,687,539 | 4,536,452 | - |
| Permits | 131,921 | 86,175 | 86,460 | 84,984 | 74,729 |
| Badging fees | - | - | - | - | 221 |
| Commercial vehicle | 1,951,963 | 1,935,659 | 1,877,940 | 1,162,170 | 40,701 |
| Miscellaneous | 496,478 | 535,305 | 782,779 | 521,191 | 483,002 |
| Camping | 2,456,707 | 2,509,533 | 2,602,805 | 2,535,781 | 1,984,099 |
| Recreational parking | 1,156,358 | 1,952,442 | 1,011,188 | 1,004,441 | 851,256 |
| Fire training | 416,708 | 316,930 | 360,749 | 247,179 | 182,801 |
| Other revenues | 382,883 | 391,219 | 403,881 | 387,933 | 246,400 |
| Special events | 18,485 | 8,744 | 13,100 | 117,192 | 82,951 |
| Concessions | 11,635 | 8,471 | 10,800 | 10,800 | 6,300 |
| Total operating revenues | 217,929,820 | 191,851,555 | 191,799,655 | 128,955,474 | 34,549,294 |
| Non-operating revenues | |||||
| Investment earnings (loss) | 11,402,252 | 11,332,065 | 7,063,893 | (804,109) | 217,578 |
| Grant revenue | 903,589 | 1,010,505 | 15,006,995 | 43,411,126 | 15,440,776 |
| Gain on sale/disposal of assets | 152,804 | 71,200 | 147,102 | 25,476 | 2,953,254 |
| Gain on legal settlement | - | - | - | 1,470,000 | - |
| Total revenues | $ 230,388,465 | $ 204,265,325 | $ 214,017,645 | $ 173,057,967 | $ 53,160,902 |
| Operating expenses | |||||
| Operations: | |||||
| Salaries | $ 6,412,574 | $ 5,744,832 | $ 4,493,765 | $ 3,334,601 | $ 1,675,206 |
| Benefits | 3,034,524 | 2,647,701 | 2,141,653 | 1,768,982 | 915,918 |
| Service contracts | 1,994,842 | 3,283,641 | 1,650,795 | 756,683 | 110,058 |
| Utilities | 74,920 | 75,276 | 81,373 | 75,145 | 67,915 |
| Maintenance and supplies | 213,426 | 195,252 | 366,306 | 148,836 | 163,079 |
| Office | 30,384 | 46,355 | 72,000 | 28,339 | 34,368 |
| Training | 881 | 4,690 | 18,011 | - | - |
| Fuel | 28,655 | 18,036 | 19,389 | 13,120 | 11,245 |
| Contractual obligations | 5,894,819 | 4,760,856 | 4,390,014 | 2,760,239 | (35,538) |
| Advertising | - | - | - | - | 199 |
| Travel | 6,992 | 2,819 | 7,474 | 4,117 | 42 |
| Education and seminars | 540 | 290 | 65 | - | - |
| Cruise terminal maintenance | - | - | - | 19,819 | - |
| Other | 48,100 | 44,765 | 25,016 | - | 15,317 |
| Total operations | 17,740,657 | 16,701,581 | 13,277,858 | 8,937,881 | 2,957,809 |
| Facilities: | |||||
| Salaries | 6,632,707 | 4,283,675 | 3,606,548 | 2,738,201 | 2,365,248 |
| Benefits | 3,151,956 | 2,616,606 | 1,833,177 | 1,483,018 | 1,662,277 |
| Service contracts | 8,521,331 | 4,308,521 | 2,606,537 | 2,385,489 | 1,107,913 |
| Utilities | 3,359,500 | 3,368,231 | 3,668,087 | 3,324,140 | 2,361,444 |
| Maintenance and support | 4,193,465 | 2,601,533 | 2,020,291 | 1,466,545 | 569,019 |
| Office | 41,667 | 14,368 | 16,648 | 14,766 | 16,676 |
| Computer support and training | 61,217 | 6,010 | 10,687 | 9,302 | 9,302 |
| Fuel | 153,465 | 149,170 | 161,482 | 145,856 | 87,192 |
| Publications | 143 | - | - | 89 | - |
| Travel | 3,710 | 5,113 | 3,442 | 1,923 | 1,436 |
| Education and seminars | 3,899 | 2,833 | 1,715 | 3,095 | 1,595 |
| Other | 78,190 | 32,675 | 25,879 | 18,651 | 5,439 |
| Total facilities | 26,201,250 | 17,083,590 | 14,254,493 | 11,602,275 | 8,277,541 |
| Public safety: | |||||
| Salaries | 625,461 | 563,710 | 488,670 | 435,539 | 323,917 |
| Benefits | 198,459 | 165,359 | 154,792 | 140,711 | 110,084 |
| Service contracts | - | - | - | - | 2,476 |
| Fire protection | 3,411,914 | 3,153,101 | 2,560,091 | 2,463,962 | 2,385,004 |
| Police services | 10,136,602 | 9,178,356 | 8,131,575 | 7,263,714 | 6,231,291 |
| Maintenance and supplies | 19,464 | 16,807 | 14,680 | 8,209 | 7,471 |
| Office | 8,027 | 4,317 | 11,395 | 10,278 | 2,516 |
| Communications services | 6,863 | 8,365 | 21,524 | 4,276 | 4,296 |
| Travel | 9,9656 | 16,785 | 15,567 | 8,286 | 1,084 |
| Education and seminars | 305 | 1,025 | 4,774 | 3,296 | - |
| Other | 8,869 | 4,885 | 10,717 | 11,058 | 9,835 |
| Total public safety | 14,425,9299 | 13,112,710 | 11,413,785 | 10,349,329 | 9,077,974 |
| Parks and recreation: | |||||
| Salaries | 1,066,549 | 838,665 | 763,120 | 740,753 | 532,024 |
| Benefits | 494,959 | 401,565 | 420,690 | 436,112 | 340,719 |
| Service contracts | 382,509 | 383,789 | 408,871 | 388,243 | 308,523 |
| Store merchandise | 66,180 | 63,127 | 59,699 | 60,423 | 18,757 |
| Utilities | 292,562 | 269,779 | 267,551 | 258,419 | 183,124 |
| Maintenance and supplies | 42,514 | 31,531 | 35,065 | 32,300 | 20,022 |
| Office | 46,930 | 36,457 | 51,512 | 24,168 | 16,663 |
| Computer support and training | 160 | 1,965 | 1,392 | 3,945 | - |
| Advertising | 13,036 | 11,999 | 8,611 | 415 | - |
| Travel | 780 | 3,351 | 1,299 | 529 | 401 |
| Education and seminars | 820 | 932 | 775 | 372 | 450 |
| Other park expense | 13,546 | 19,300 | 15,705 | 4,193 | 2,223 |
| Total parks and recreation | 2,420,545 | 2,062,460 | 2,034,290 | 1,949,872 | 1,422,906 |
| Exploration tower: | |||||
| Salaries | - | - | 26,193 | 107,053 | 114,299 |
| Benefits | - | - | 18,515 | 58,110 | 63,008 |
| Service contracts | - | 133 | 948 | 3,237 | 8,602 |
| Store merchandise | 106 | - | - | 34,803 | 37,783 |
| Utilities | 77,371 | 88,903 | 75,187 | 38,654 | 8,229 |
| Exhibit and special events | - | 1,210 | 5,919 | 4,272 | 2,383 |
| Maintenance and supplies | - | 113 | - | 878 | 921 |
| Office | - | 250 | 6,170 | 329 | 591 |
| Promotions | - | - | 175 | 1,500 | (65) |
| Advertising | - | - | - | 1,659 | - |
| Trade development | - | - | 927 | 424 | - |
| Travel | - | - | 40 | 234 | - |
| Other expenses | - | - | - | - | - |
| Total exploration tower | 77,477 | 90,609 | 133,074 | 251,150 | 235,751 |
| Fire training facility: | |||||
| Service contracts | 264,743 | 228,498 | 245,358 | 190,322 | 135,897 |
| Utilities | 73,236 | 48,109 | 53,434 | 29,558 | 43,322 |
| Insurance | 78,770 | 68,719 | 51,916 | 39,390 | 38,240 |
| Maintenance and supplies | 21,154 | 33,385 | 34,194 | 35,383 | 20,759 |
| Office | - | - | - | - | - |
| Accounting | 500 | 500 | 500 | 500 | - |
| Total fire training facility | 438,403 | 379,211 | 385,402 | 295,153 | 238,218 |
| Commission: | |||||
| Salaries | 150,900 | 141,500 | 131,088 | 128,242 | 110,104 |
| Benefits | 142,520 | 143,081 | 126,549 | 119,511 | 115,414 |
| Legal | 41,760 | 40,644 | 58,745 | 40,408 | 31,873 |
| Maintenance and supplies | 583 | 10 | 29 | 59 | 46 |
| Office | 3,100 | 4,650 | 4,715 | 4,288 | 4,710 |
| Planning and studies | - | - | 3,830 | - | - |
| Promotions | 625 | 1,210 | 3,161 | 356 | 3,020 |
| Advertising | 67 | 213 | 424 | 400 | 341 |
| Travel | 15,622 | 7,104 | 10,078 | 9,156 | 250 |
| Education and seminars | - | - | - | 600 | - |
| Total commission | 355,177 | 329,412 | 338,619 | 303,020 | 265,758 |
| Executive: | |||||
| Salaries | 2,526,320 | 2,390,073 | 1,508,983 | 1,331,597 | 1,138,853 |
| Benefits | 580,453 | 463,513 | 372,110 | 355,072 | 318,024 |
| Service contracts | - | 136,067 | 58,750 | - | - |
| Legal | 26,725 | 29,038 | 31,919 | 47,148 | 97,952 |
| Maintenance and supplies | 226 | 30 | 180 | 70 | 64 |
| Office | 231,472 | 192,603 | 187,493 | 107,332 | 152,437 |
| Fraud hotline | 3,494 | 576 | 2,446 | 2,626 | 4,163 |
| Advertising | - | 124 | 351 | - | - |
| Travel | 19,453 | 11,963 | 19,057 | 5,968 | 1,840 |
| Education and seminars | 4,367 | 9,893 | 2,426 | 3,847 | 89 |
| Other expenses | - | - | - | - | 583 |
| Total executive | 3,392,510 | 3,233,880 | 2,183,715 | 1,853,660 | 1,714,005 |
| Finance and accounting: | |||||
| Salaries | 1,590,864 | 1,517,263 | 1,351,494 | 1,184,217 | 1,108,949 |
| Benefits | 657,140 | 555,615 | 506,693 | 462,994 | 393,768 |
| Service contracts | 67,350 | 9 | 2,957 | 71,570 | 281 |
| Maintenance and supplies | 681 | 97 | 328 | 268 | 77 |
| Office | 44,089 | 17,928 | 19,376 | 42,512 | 9,426 |
| Advertising | 1,815 | 1,745 | 5,594 | 3,647 | 6,733 |
| Travel | 17,184 | 7,373 | 6,882 | 7,078 | 696 |
| Education and seminars | 2,161 | - | 490 | 1,339 | 869 |
| Other expenses | 1,213 | 145 | - | - | - |
| Accounting | 113,460 | 164,724 | 138,438 | 127,099 | 122,064 |
| Total finance and accounting | 2,495,957 | 2,264,899 | 2,032,252 | 1,900,724 | 1,642,863 |
| Administrative services: | |||||
| Salaries | 3,038,096 | 2,918,251 | 2,468,423 | 2,032,280 | 1,744,807 |
| Benefits | 1,229,145 | 1,092,369 | 920,485 | 772,052 | 720,471 |
| Service contracts | 237,869 | 224,906 | 184,479 | 162,431 | 171,651 |
| Utilities | 71 | 73 | 376 | ||
| Legal | 57,650 | 33,742 | 139,489 | 10,634 | 77,645 |
| Insurance | 4,295,668 | 5,043,968 | 4,481,010 | 3,848,529 | 3,574,932 |
| Maintenance and supplies | 20,586 | 9,510 | 13,269 | 7,541 | 5,815 |
| Office | 480,443 | 372,158 | 129,215 | 73,576 | 73,082 |
| Recruiting | 179,965 | 128,781 | 122,600 | 125,965 | 10,288 |
| Computer support and training | 2,352,952 | 1,414,405 | 1,358,940 | 1,076,680 | 1,066,899 |
| Advertising | 155 | 1,538 | 429 | 89 | - |
| Travel | 12,362 | 14,224 | 13,291 | 2,006 | 77 |
| Education and seminars | 24,419 | 11,700 | 14,159 | 10,969 | (206) |
| Total administrative services | 11,929,310 | 11,265,623 | 9,845,862 | 8,122,811 | 7,445,837 |
| Engineering and environmental: | |||||
| Salaries | 1,408,537 | 1,345,598 | 1,188,299 | 998,883 | 899,608 |
| Benefits | 565,480 | 509,040 | 477,425 | 405,682 | 336,522 |
| Service contracts | 119,165 | 104,279 | 90,982 | 90,912 | 85,553 |
| Maintenance and supplies | 2,010 | 348 | 59,106 | 1,300 | 321 |
| Office | 9,068 | 7,198 | 5,228 | 5,817 | 3,586 |
| Advertising | 315 | 1,079 | 6,823 | 2,705 | - |
| Travel | 13,493 | 9,771 | 17,098 | 5,610 | 516 |
| Education and seminars | 4,862 | 3,758 | 4,676 | 4,374 | 311 |
| Engineering – general | 323,873 | 200,344 | 172,755 | 99,920 | 76,853 |
| Engineering – environment | 525,544 | 290,934 | 292,246 | 269,632 | 309,113 |
| Total engineering and environmental | 2,972,347 | 2,472,349 | 2,314,638 | 1,884,835 | 1,712,383 |
| Business development: | |||||
| Salaries | 644,508 | 641,390 | 553,502 | 462,773 | 526,207 |
| Benefits | 239,136 | 203,138 | 194,291 | 177,527 | 198,774 |
| Maintenance and supplies | 430 | 100 | 95 | 211 | 125 |
| Office | 45,529 | 38,529 | 37,809 | 21,093 | 13,186 |
| Promotions | 1,500 | ||||
| Advertising | 24,200 | 21,940 | 14,545 | - | (3,500) |
| Trade development | 136,650 | 188,226 | 169,160 | 102,571 | (75) |
| Travel | 27,441 | 19,767 | 19,201 | 9,355 | 2,230 |
| Education and seminars | 85 | 343 | 1,465 | - | - |
| Total business development | 1,119,479 | 1,113,433 | 990,068 | 773,530 | 736,269 |
| Real estate: | |||||
| Salaries | 359,706 | 252,165 | 238,425 | 191,317 | 46,399 |
| Benefits | 119,667 | 69,456 | 65,225 | 53,109 | 17,741 |
| Service contracts | 746 | 1,649 | 839 | 956 | 3,003 |
| Maintenance and supplies | 1,699 | 4,725 | (24,886) | 4,490 | 9,640 |
| Office | 686 | 13,948 | 35,144 | 2,403 | 78,010 |
| Land use planning | - | 8,514 | 8,786 | 15,900 | 11,100 |
| Lease preparation | 43,470 | 43,310 | 56,504 | 61,351 | 325,837 |
| Advertising | - | 2,460 | - | - | - |
| Travel | - | 1,826 | - | - | - |
| Total real estate | 525,974 | 398,053 | 380,037 | 329,526 | 491,730 |
| Government and strategic communications: | |||||
| Salaries | $ 923,875 | $ 824,296 | $ 717,495 | $ 599,665 | $ 533,241 |
| Benefits | 340,378 | 243,830 | 207,383 | 166,915 | 159,823 |
| Service contracts | - | 66 | - | - | - |
| Maintenance and supplies | 215 | 132 | 126 | 62 | 95 |
| Office | 31,185 | 14,683 | 9,200 | 9,433 | 4,053 |
| Computer support and training | - | - | - | - | 1,188 |
| Planning and studies | - | - | 53,000 | - | - |
| Promotions | 84,498 | 48,830 | 60,131 | 26,757 | 2,545 |
| Publications | 1,025 | 2,018 | 24,061 | 992 | 3,907 |
| Electronic media | 36,912 | 22,777 | 17,340 | 16,455 | 9,972 |
| Advertising | 32,582 | 24,362 | 166 | - | 9,100 |
| Sponsorship | 51,181 | 48,665 | 44,880 | 33,815 | 360 |
| Travel | 37,885 | 16,136 | 18,341 | 16,301 | 1,851 |
| Professional services | 274,638 | 245,500 | 239,500 | 230,000 | 213,000 |
| Education and seminars | 2,460 | 3,706 | 4,609 | 2,928 | 411 |
| Total government and strategic communications | 1,816,834 | 1,492,001 | 1,396,232 | 1,103,323 | 939,546 |
| Depreciation | 48,372,263 | 46,587,231 | 47,387,275 | 48,790,189 | 49,078,633 |
| Amortization | 1,220,748 | 1,249,788 | 467,526 | 456,770 | 611,115 |
| Total operating expenses | 135,504,860 | 119,959,732 | 108,835,126 | 98,904,048 | 86,848,338 |
| Non-operating expenses | |||||
| Amortization of bond discounts | - | 51,375 | 62,769 | 62,768 | 137,675 |
| Commissions and fees | 45,451 | 97,186 | 95,093 | 148,622 | 183,030 |
| Interest expense | 11,426,261 | 12,101,576 | 12,219,324 | 12,076,856 | 12,379,203 |
| Loss on disposal of capital assets | 95,292 | 1,219,785 | 100,683 | - | 1,658,837 |
| Litigation expense | - | - | - | 25,159 | 488,132 |
| Covid expense | - | - | - | - | 83,067 |
| Crane disposal | 1,395,347 | - | - | - | - |
| Hurricane repairs | 480,355 | 137,881 | 995,650 | 234,461 | 880 |
| Total non-operating expense | 13,442,706 | 13,607,803 | 13,473,519 | 12,547,866 | 14,930,824 |
| Total expenses | $ 148,947,566 | $ 133,567,535 | $ 122,308,645 | $ 111,451,914 | $ 101,779,162 |
| Total operating revenues | $ 217,929,820 | $ 191,851,555 | $ 191,799,655 | $ 128,955,474 | $ 34,549,294 |
| Total operating expenses | 135,504,860 | 119,959,732 | 108,835,126 | 98,904,048 | 86,848,338 |
| Net operating income (loss) | $ 82,424,960 | $ 71,888,823 | $ 82,964,529 | $ 30,051,426 | $ (52,299,044) |
| Total non-operating revenues | $ 12,458,645 | $ 12,413,770 | $ 22,217,990 | $ 44,102,493 | $ 18,611,608 |
| Total non-operating expenses | 13,442,706 | 13,607,803 | 13,473,519 | 12,547,866 | 14,930,824 |
| Net non-operating income (loss) | $ (984,061) | $ (1,194,033) | $ 8,744,471 | $ 31,554,627 | $ 3,680,784 |
| Total revenues | $ 230,388,465 | $ 204,265,325 | $ 214,017,645 | $ 173,057,967 | $ 53,160,902 |
| Total expenses | 148,947,566 | 133,567,535 | 122,308,645 | 111,451,914 | 101,779,162 |
| Net income (loss) before capital contributions | 81,440,899 | 70,694,790 | 91,709,000 | 61,606,053 | (48,618,260) |
| Capital contributions | 2,290,263 | 14,646,267 | 30,442,555 | 23,502,430 | 287,128 |
| Changes in net position | $ 83,731,162 | $ 85,341,057 | $ 122,151,555 | $ 85,108,483 | $ (48,331,132) |
*FY2024 was restated due to implementation of GASB 101, Compensated Absences
Canaveral Port Authority
Schedule of Comparative Operating Revenues by Activity (Unaudited)
Fiscal Years Ended September 30,
| 2025 | 2024 | 2023 | 2022 | 2021 | |
|---|---|---|---|---|---|
| Cruise | $ 181,884,695 | $ 156,032,210 | $ 158,015,193 | $ 99,014,902 | $ 10,184,479 |
| Cargo | 24,541,740 | 23,216,396 | 20,538,883 | 18,488,881 | 11,143,105 |
Total ship related operating revenue | 206,426,435 | 179,248,606 | 178,554,076 | 117,503,783 | 21,327,584 |
| Leases | 4,480,248 | 5,748,471 | 6,195,877 | 5,380,030 | 9,258,649 |
| Recreation | 4,018,285 | 3,970,409 | 3,941,774 | 4,056,137 | 3,181,606 |
| Miscellaneous | 3,004,852 | 2,884,069 | 3,107,928 | 2,015,524 | 781,455 |
Total non-ship related operating revenue | 11,503,385 | 12,602,949 | 13,245,579 | 11,451,691 | 13,221,710 |
| Total operating revenue | $ 217,929,820 | $ 191,851,555 | $ 191,799,655 | $ 128,955,474 | $ 34,549,294 |
Fiscal Year Ended September 30, 2025
| Actual | Budget | ||||
|---|---|---|---|---|---|
| Prior Years | Current Year | Cumulative Total | Cumulative Total | ||
| Road Improvements | $ 1,021,889 | $ 2,071,911 | $ 3,093,800 | $ 8,558,998 | |
| Portwide Parking Lot Improvement | 8,355,788 | 4,800,608 | 13,156,396 | 18,364,746 | |
| Portwide Parking Improvements | 60,521,391 | 1,707,963 | 62,229,354 | 68,058,803 | |
| Security Fencing/Lighting | 213,452 | 533,587 | 747,039 | 821,347 | |
| Maintenance Dredging | 6,153 | 6,613,605 | 6,619,758 | 6,655,314 | |
| Other Computer Equipment | 558,061 | 1,706,984 | 2,265,045 | 2,313,390 | |
| Park Upgrades | 1,824,763 | 1,703,803 | 3,528,566 | 4,487,045 | |
| Improve Piers, Bldgs, Structures | 3,003,026 | 9,692,719 | 12,695,745 | 14,647,391 | |
| Fire Equipment | - | 75,870 | 75,870 | 75,870 | |
| Fire Training Equipment | 8,444 | 8,619 | 17,063 | 558,740 | |
| Utilities and Improvements | 412,361 | 2,740,901 | 3,153,262 | 3,172,763 | |
| Minor Equipment | - | 425,847 | 425,847 | 526,038 | |
| New/Replacement Vehicles | 2,052,194 | 2,057,875 | 4,110,069 | 4,130,517 | |
| CT Furniture/Equipment | 1,854,864 | 2,861,884 | 4,716,748 | 7,726,321 | |
| Stormwater Improvements | 123,096 | 666,869 | 789,965 | 828,402 | |
| Cove Roads Phase 2 | 502,292 | - | 502,292 | 502,292 | |
| CT 5 Terminal Upgrades | 269,575 | 6,371,515 | 6,641,090 | 6,667,896 | |
| CT10 Terminal Improvements | 1,385,571 | 9,337,315 | 10,722,886 | 11,623,306 | |
| Cruise Terminal 7 | 117,344 | 13,711 | 131,055 | 5,412,000 | |
| CT2 2025 | - | 737,509 | 737,509 | 800,000 | |
| Maritime Ctr Tenant Improvement | 644,841 | 2,563,351 | 3,208,192 | 3,371,892 | |
| CT# 8 Renovations | 6,400 | 1,050,875 | 1,057,275 | 1,349,431 | |
| WTB Channel Entrance Phase 2 | 2,419,556 | - | 2,419,556 | 2,419,556 | |
| Public Harbor Projects | - | 35,110 | 35,110 | 151,436 | |
| PSGP 2021 Projects | 539,780 | 292,337 | 832,117 | 849,967 | |
| PSGP 2022 Projects | 681 | 584,088 | 584,769 | 600,000 | |
| CT#1 Cruise Terminal | - | 1,464,977 | 1,464,977 | 1,917,591 | |
| North Cargo Berth 4 | 30,125,842 | 10,532,549 | 40,658,391 | 45,187,454 | |
| Auto Terminal | 95,390 | - | 95,390 | 95,390 | |
| North Cargo Power Project | 49,796 | - | 49,796 | 49,796 | |
| CT Pax Bridge Renovation | 3,270,118 | 4,296,853 | 7,566,971 | 13,913,658 | |
| Emergency Generators | - | 98,947 | 98,947 | 453,000 | |
| Mobile Harbor Crane | 3,260,700 | 4,909,558 | 8,170,258 | 11,697,475 | |
| LNG Fire Trainer Expansion | 70,194 | - | 70,194 | 70,194 | |
| CBP Tech Upgrades | 541,281 | 170,622 | 711,903 | 761,490 | |
| West Side Infrastructure | 68,795 | 4,580 | 73,375 | 1,018,961 | |
| Total | $ 123,323,638 | $ 80,132,942 | $ 203,456,580 | $ 249,838,470 | |
Appendix A - Schedule of Insurance in Force (Unaudited)
Fiscal Year Ended September 30, 2025
| Property Coverage | |
| Total insured values | $ 1,074,263,343 |
| Limit on buildings, contents, EDP, flood, equipment, terrorism and boats | $ 200,000,000 |
| Port Liability | |
| Comprehensive per occurrence/bodily injury and property damage | $ 25,000,000 |
| Automobile Liability and Physical Damage | |
| Bodily injury and property damage | $ 1,000,000 |
| Auto medical payments, any one accident or loss | $ 5,000 |
| Personal injury protection | Statutory |
| Hired and non-owned auto liability | $ 1,000,000 |
| Excess Port Liability (including Auto and Employers Liability) | |
| Per occurrence/aggregate | $ 75,000,000 |
| Public Officials Liability, Claims Made Policy, includes D&O and EPLI | |
| Each claim and aggregate, including claims expense | $ 3,000,000 |
| Comprehensive Crime Insurance | |
| Employee theft, per loss/aggregate | $ 1,000,000 |
| Forgery or alteration | $ 1,000,000 |
| Computer fraud | $ 1,000,000 |
| Florida Storage Tank | |
| Each incident/aggregate | $ 2,000,000 |
| Fiduciary Liability, Claims Made Policy | |
| Aggregate | $ 1,000,000 |
| Workers' Compensation, Employers Liability | |
| Bodily injury by accident/each accident | $ 1,000,000 |
| Bodily injury by disease/each employee | $ 1,000,000 |
| Bodily injury by disease/aggregate | $ 1,000,000 |
| Hull and Machinery / Protection and Indemnity / Vessel Pollution Liability | |
| Hull limit | $ 6,247,200 |
| P&I limit | $ 1,000,000 |
| Excess P&I | $ 5,000,000 |
| Vessel pollution limit | $ 5,000,000 |